Accurion EP4, the latest imaging ellipsometer, combines ellipsometry and microscopy to accurately characterize thickness and refractive index on microstructures as thin as 1 µm. Unlike conventional ellipsometers, all structures within the field of view are measured concurrently.
The EP4 offers ellipsometric-contrast live view, detecting sub-nm features and identifying regions of interest to acquire thickness values, 3D maps (0.1 nm—10 µm), and refractive index. Additional accessories are available for expanding measurements under controlled settings or temperature changes.
The Microscopic Way of Doing Ellipsometry
Simultaneous Measurement of All Pixels inside the Field of View
Spectroscopic ellipsometry on each pixel
Highest Lateral Ellipsometric Resolution
Microstructures as small as 1 µm can be measured to determine thickness and refractive index.
First Identify, Then Measure
Drawing regions in the live ellipsometric display allows for intuitive measurement region selection.
Continuous Spectroscopic Imaging Ellipsometry
From UV to NIR
Key Features
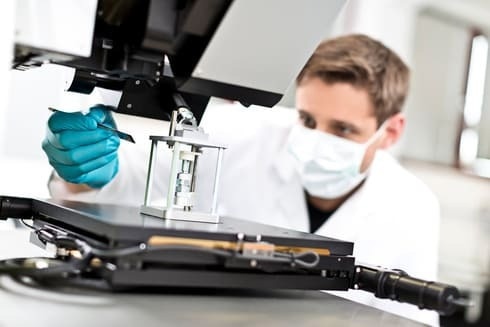
Image Credit: Park Systems
- Simultaneously measuring all pixels within the field of view results in spectroscopic ellipsometry for each pixel
- Imaging Spectroscopic Ellipsometry from 190/250/360 nm to 1000/1700/2700 nm
- Microstructures as small as 1 µm can have their thickness and refractive index determined, thanks to the highest lateral ellipsometric resolution of 1 µm
- Images with ellipsometric enhanced contrast for a real-time sample visualization
- Determine first, then measure: Choosing the measuring region intuitively by drawing it in real time
- Multiple locations within the chosen field of view are measured in parallel
- Knife-edge lighting for nondestructive suppression of disturbing backside reflections
- Increase measurement capabilities using extra attachments, such as cells, temperature control, or liquid handling
- Quality Control: Also available as OEM version for QC in product lines
Accurion EP4 Introduction
The EP4, the most recent generation of imaging ellipsometers, combines ellipsometry with microscopy. Ellipsometry can accurately measure the thickness and refractive index of microstructures as thin as 1 µm.
Accurion EP4 | Our Latest Generation of Imaging Ellipsometers Combines Ellipsometry and Microscopy
Video Credit: Park Systems
EP4 Software
The EP4 software is modular and enables direct control and parallel or offline analysis. The EP4 control operates the instrument. The live display allows users to select measurement regions. Multiple samples can be organized and measured automatically. The DataStudio allows for the processing of recorded data. Histogram analysis and line profiles provide valuable insight into the details of the samples.
The EP4 Model enables sample modeling. Its user-friendly interface allows for the creation of simple to complicated thin film sample configurations. The model provides information about the sample's thickness and refractive indices. Other physical parameters, such as the bandgap or volume fraction of a mixed material layer, can also be derived.
Accurion EP4 modelling software | Park Systems
Video Credit: Park Systems
Applications
2D-Materials
Graphene and other 2D materials are characterized using imaging spectroscopic ellipsometry, which analyzes CVD-grown, exfoliated, and epitaxially formed flakes with the EP4 ellipsometer.
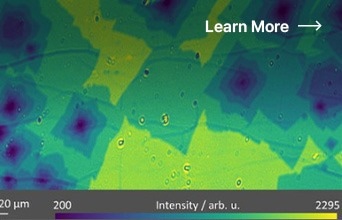
Image Credit: Park Systems
Curved Surfaces
Ellipsometry tests thin films and AR coatings on both flat and curved surfaces. The EP4 ellipsometer addresses AR coating concerns on microlens arrays.
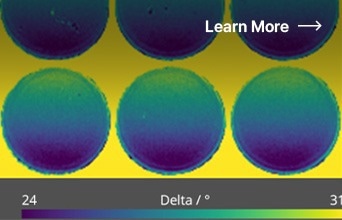
Image Credit: Park Systems
Transparent Substrate
Thin films on transparent substrates are essential for flexible displays. Knife-edge illumination reduces reflections, enabling non-destructive examination.
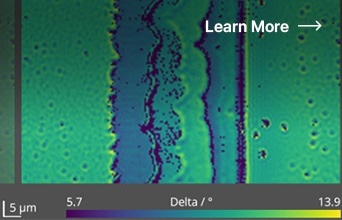
Image Credit: Park Systems
Surface Engineering
Silanization is a process that binds mineral/inorganic and organic components in paints and adhesives. Imaging ellipsometry studies bond formation in structured arrays that lack fluorescence markers.
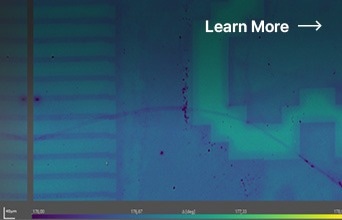
Image Credit: Park Systems
Air-Water Interface
The air-water interface is critical in biophysics and industry. Langmuir-Blodgett monolayers and biological materials are visualized using Brewster angle microscopy (BAM), which is used to study molecules, proteins, medicines, DNA, and nanoparticles.
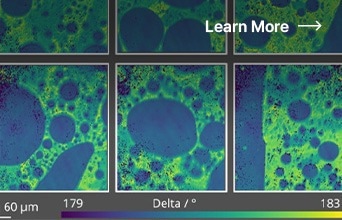
Image Credit: Park Systems
Anisotropic Films
Anisotropic microcrystals show promise for electronics. Imaging Mueller Matrix Ellipsometry (IMME) detects refractive indices and optical axis orientation in anisotropic thin-film materials such as Black Phosphorous.
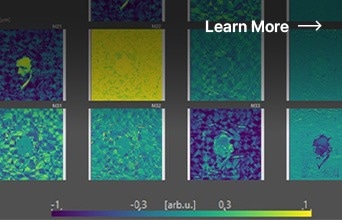
Image Credit: Park Systems
Bio Interfaces
Imaging Ellipsometry (IE) is highly sensitive to monolayer and submonolayer thicknesses. It includes microamps of ellipsometric angles and a contrast mode for changing thickness. Accessories such as cells and QCM-D expand their biological application possibilities.
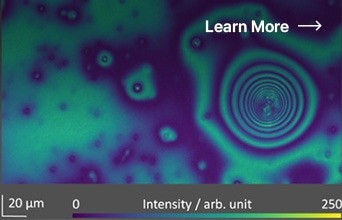
Image Credit: Park Systems
MEMS
With a resolution of 0.1 nm for film thickness, spectroscopic ellipsometry measures MEMS structures as small as 1 µm. Composition, contaminations, thickness, and refractive index are all provided in a single measurement. ECM mode makes curved surface measurements and quick quality control possible.
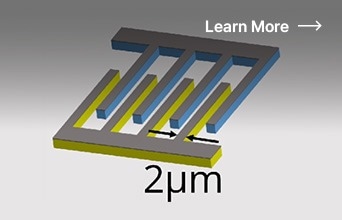
Image Credit: Park Systems
Photonics
Optical fibers and waveguides are measured using spectroscopic ellipsometry with a lateral resolution of 1 µm and a thickness resolution of 0.1 nm. Its 190–1700 nm coverage and 2700 nm extension offer optical data and a quick quality check.
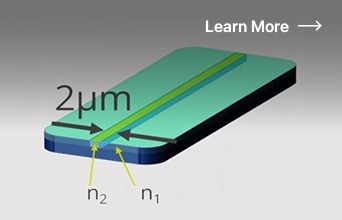
Image Credit: Park Systems
Displays
The ROI concept is used for several measurements in a single run in spectroscopic measurements on micron-scale regions. Display materials are characterized by the UV range down to 190 nm. Thickness, dispersions, and compositions can all be determined with a single measurement, and RCE6 mode permits tact times of less than 20 seconds.
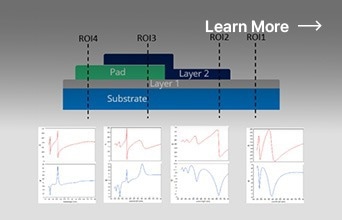
Image Credit: Park Systems
Battery Materials
Operando Imaging Ellipsometry measures microscopic Delta and Psi maps of battery electrode materials as they charge and discharge. It gives data from multiple regions, including post-processing analysis such as profiles, sub-regions, and histograms.
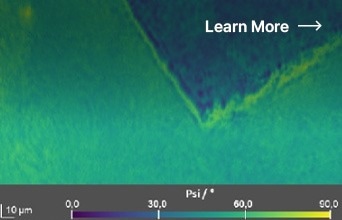
Image Credit: Park Systems