Sponsored by HORIBAOct 24 2013
A new class of materials called Carbon NanoTubes (CNTs) has attracted significant interest for a wide range of engineering applications. These materials look similar to graphitic carbon in structure. The structure of a Single-Walled Carbon Nanotube (SWNT) can be conceptualized by visualizing a single layer of graphite rolled into a tube, as illustrated in figure 1.
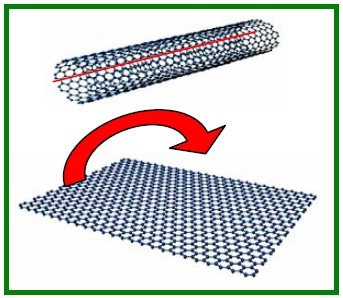
Figure 1. Illustration of the structure of a single walled carbon nanotube from a graphite sheet.
Multi-Walled Carbon Nanotube (MWNT)
When numerous layers of graphite are rolled into a single tube, the ensuing structure is dubbed as Multi-Walled Carbon Nanotube (MWNT). Raman spectra of these tubes are very interesting owing to sensitivity and resonance phenomena to tube structure.
In other words, there is strong excitation wavelength dependence of the spectra that result from the electronic band structure. In CNTs, the resonance Raman behavior is unique in that both the scattered photon and incident have the potential to resonate with the electronic excitations. Owing to this reason, the characteristics in the Raman spectra are diagnostic of the CNT type.
Raman Spectrum of SWNT
Radial Breathing Mode (RBM) is the most critical aspect in the Raman spectrum of CNT and is usually observed from 100 to 250cm-1. The RBM’s frequency is related to the reciprocal of the nanotube diameter (dt). In the case of an isolated SWNT, this relation is [1]:
ωr= 224/dt
But, non isolated SWNTs are subject to inter-tube interactions which tend to boost the RBM’s frequency.
The D mode or the disorder band is anticipated to be observed in Multi Walled NanoTubes (MWNT), but when it is observed in SWNTs, it is assumed that it is because of defects in the tubes. The G mode, also known as TM- Tangential Mode, matches to the stretching mode of the -CC- bond in the graphite plane. This mode is placed close to 1580cm-1.
Excitation Wavelength Dependence
As stated earlier, there is intense excitation wavelength dependence on the Raman intensity of SWNTs which results from the immediacy of the laser wavelength to the transitions between electronic states. The densities of states determine the transition intensities and energies and are very sensitive to the tube structure.
Each SWNT has a Resonance Raman spectrum in a specific range of excitation wavelengths. Figure 2 illustrates the Kataura plot that links the frequency of the Raman shift of the RBM to the energy isolation of the peaks in the densities of states for each type of tube distinguished by (n,m). In resonance conditions, the Raman signal is greatly improved and one can even record the Raman spectrum of an isolated CNT from which one can ascertain its electronic and structural properties. As a result, the Kataura plot sums up all the data included in the Raman spectrum. Figure 3 shows that this method is suitable to selectively improve the Raman spectrum of different SWNTs.
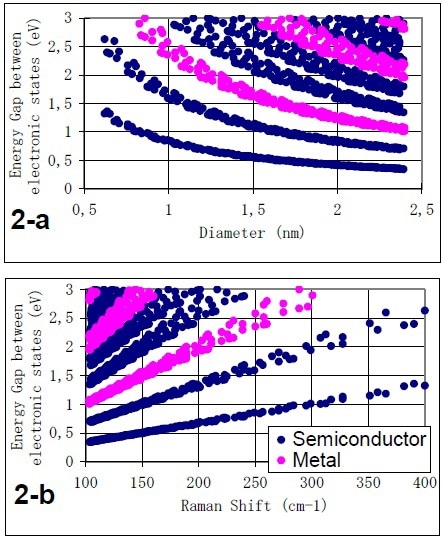
Figure 2. Kataura plots based on the energy of the C-C nearest neighbour interaction of 2.9eV
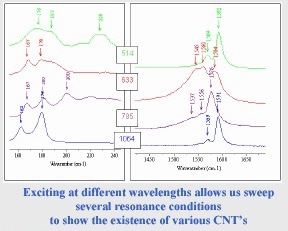
Figure 3. Spectra recorded at several wavelengths on thesurface of a powder of SWNT’s
Spectral and Spatial Resolutions
High spectral resolution is required to isolate very close modes in the spectrum of a single or multiple CNTs.
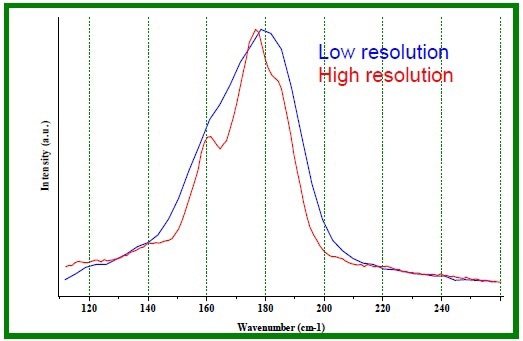
Figure 4. RBM Raman spectrum of a sample bundle of SWNT's LabRAM at 633nm.
A RBM spectrum shown in the above figure denotes a collection of a minimum of three different tubes in the laser focal volume.
The spectrum of a single isolated SWNT can be identified by using resonant conditions in Raman micro-spectroscopy. The complexity in those experiments is to localize the nanotube on the surface. A large area of the substrate can be probed using a map. This is a standard way to detect the “hot spot”.
From the RBM frequency, the tube diameter can be estimated at each measurement point. The tubes in this experiment are dispersed on a silicon substrate and have a diameter of about 0.8nm to 1.5nm. In spite of the fact that the laser spot is larger than the tube diameter, the tubes’ resonance behaviour makes it possible to record the spectra.
Since light absorption in nanotubes is very high, the temperature of the material will increase and can at times promote changes in the sample. Hence, it is important to check the effects of power density at the sample. Due to temperature changes in CNTs, temperature fluctuations and induce frequency down-shifts can be easily detected.
Photoluminescence Emission
Besides Raman scattering, Photoluminescence emission of the excited sample can provide information on the structure of CNTs. This latest technique can also be used to study the physical and chemical properties of CNTs.
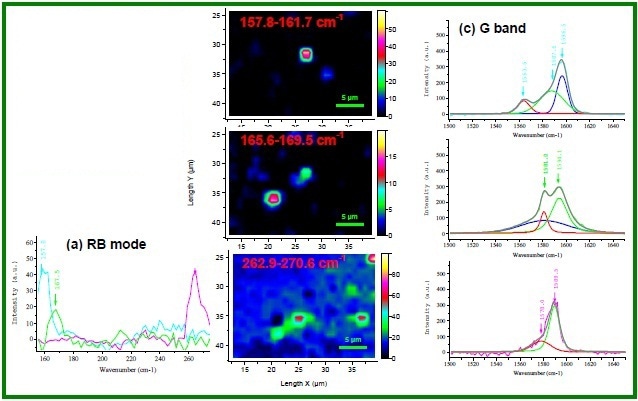
Figure 5. Raman and PL intensity maps of the same sample area.
Photoluminescence and Raman imaging can be carried out on the same area with the same instrument, as illustrated in figure 5. The link between the two intensity maps is good and the data achieved is complementary
Conclusion
Different types of information about CNTs can be obtained, depending on the configuration of the Raman system utilized. Raman system is suitable for acquiring maximum information as it has a high potential in characterizing the structure of SWCNTs. Information about structure with chemical and physical properties make the technique suitable for controlling the quality of the SWCNTs for particular applications.

This information has been sourced, reviewed and adapted from materials provided by HORIBA.
For more information on this source, please visit HORIBA.