Sponsored by HORIBAOct 28 2013
Chemometrics or multivariate techniques are normally applied to a range of solutions or material mixtures in an attempt to develop methods to “predict” concentrations of the various chemical species. Actually the same mathematical techniques can be applied to elucidate physical properties as well. These two applications of Chemometrics are useful in the polymer field.
Indeed, as far as polymeric fibres are concerned, slight modifications of Raman features are directly related to differences in the molecular orientation and the degree of crystallinity of the fibres. In order to use these subtle spectral changes and correlate them with physical properties of the polymer, one is obliged to use Chemometrics on the Raman spectra. Chemometrics is also useful to monitor polymerisation reactions.
Chemometrics Applied to Polarized Raman Spectra of Polyethylene Terephtalate Fibers
Spin-oriented and drawn polymeric fibres find applications in the textile industry and in many engineering applications (such as tire cord). The chemical and physical properties of these fibres do not just depend on the chemical composition, but also on the mode of fabrication. Finally the percentage crystallinity and the molecular orientation can be associated with properties such as dyeability, tenacity (strength), glass transition temperature, melting temperature, and other thermal properties such as possible % shrinkage.
This study uses multivariate techniques to predict physical properties of PET fibres that are measured by other, perhaps more time consuming methods. The ability to predict birefringence (which is directly related to molecular orientation) and crystallinity is shown. Other physical properties include dyeability, the glass transition temperature (Tg), crystallisation temperature (Tm), tenacity, draw potential before breakage, or shrinkage potential during heat treatment.
The ability to predict such properties is based on the fact that they depend on:
- Amorphous vs. crystalline composition
- The orientation of the amorphous material which can be monitored with the polarization dependence and
- The conformation of the glycol bonds which can be monitored by following details in the single bond fingerprint region of the spectrum
Raman spectra was measured with the scattered and laser polarization in the same plane and the fibre was either oriented parallel or perpendicular to the direction of polarisation.
Table 1 shows the fiber histories.
One set of fibres was spin-oriented with take-up speeds (TUS) between 1500 and 5500m/min. Some of the fibres in this set were drawn at room temperature (RT) to the break point and a third set of fibres was spun at 500m/min and then doubly drawn at temperatures above Tg. The properties of these fibres are tabulated in Table I. The polarized Raman spectra of fibres of PET as shown in Figure 1 have been used to monitor orientation, crystallinity, and conformation of the glycol single bonds.
Table 1. Histories of the different sets of fibres
| TUS (m/min) |
Birefringence |
Crystallinity |
C=O FWHM (cm-1) |
| Spun Fibres |
| 1500 |
11,2 |
0 |
25 |
| 2500 |
24,9 |
0 |
25 |
| 3500 |
47,3 |
0 |
26 |
| 4500 |
75,2 |
11,1 |
22 |
| 5500 |
107,4 |
23,7 |
17 |
| Spun Fibres Drawn at Room temperature* |
| 1500 |
163,5 |
(0) |
25,5 |
| 2500 |
153,5 |
(0) |
25,3 |
| 3500 |
147,5 |
(0) |
24 |
| 4500 |
135,7 |
(11,1) |
17 |
| 5500 |
125,0 |
(23,7) |
17,8 |
| Birefringence Measurements made by Mike Jaffe at Hoechst-Celanese |
| Fibres Spun and drawn at 90 and 150°C |
| 500 3.8X |
205,0 |
29,1 |
18,2 |
| 500 4.2X |
207,7 |
29,5 |
18,3 |
| 500 4.6X |
203,9 |
31,7 |
19,2 |
| 500 5.0X |
213,0 |
26,9 |
19 |

Figure 1. Polarized Raman microprobe spectra of spin-oriented fibers of polyethylene terephthalate after room temperature draw
The interesting characteristics of these spectra can be summarized as follows:
- The differences between the ZZ and RR spectra increase with TUS and/or draw ratio (ie. birefringence)
- The >C=O band at ca. 1730 cm-1 sharpens in the crystalline phase
- The behavior in the glycol region (950- 1200 cm-1) reflects the conformation of the single bonds which correlates with orientation, but not necessarily crystallinity
It is important to consider what spectral pre-treatments are required at the beginning of a multivariate analysis application. Successful multivariate analysis resulted from use of the ZZ minus RR spectra. Modelling the birefringence with a PLS algorithm was always successful (R2>0.96) and normally only 2 factors were necessary to account for most of the variance. Changes in the Chemometrics data treatments resulted in fine-tuning the model.
Models based on the full fingerprint spectrum (600 - 1800 cm-1) were better than models based only on the glycol single bond region of the spectrum. Modelling the crystallinity of these fibres was less successful, possibly because 6 of the 14 fibres in the training set were non-crystalline (cristallinity = 0).
The crystallinity was modeled indirectly by modelling on the full width at half maximum (FWHM) of the carbonyl band from the summed spectral since this band is known to correlate with crystallinity in aromatic polyesters. Using the spectral region from 1550 to 1785 cm-1 produced the best model. In this case 4 factors were needed to account for the variance, producing an R2 value of 0.959. Figure 2 shows the cross validation results.

Figure 2. Cross-validation results showing the consistency of the modelling
Chemometrics Applied to On-line Monitoring of Polymerization Reactions
Polymerization reactions are based on complicated processes that are tough to predict through mathematical models, especially without experimental data. Hence to improve and control the polymerization processes, the use of an accurate and fast on-line analysis technique is of great importance. Raman spectroscopy is highly sensitive to vibrations of carbon double bonds of the monomers that are consumed during the polymerization process. Hence monitoring the intensity of their associated Raman features enables one to follow the evolution of the reaction.
The results of a co-polymerization reaction of 90% vinyl di-chloride (VC2) and 10% methyl acrylate (ACM) will be shown. A NIR excitation was used in order to avoid fluorescence emission, and a new adjustable immersion probe in Figure 3 significantly improved the results.

Figure 3. SuperHead equipped with the immersion accessory
Spectra collected at various times during the reaction and reproduced in Figure 4 clearly highlight the disappearance of the C=C bonding (1600-1650 cm-1), thereby indicating the consumption of both monomers. As the Raman bands associated with the C=C bond of these two monomers as shown in Figure 4 are well separated from each other (1612 cm-1 versus 1632 cm-1), a univariate analysis based on band integration was possible.

Figure 4. Raman spectra at different times of the reaction
The Chemometrics model was built from a set of about 20 spectra selected from the total set of spectra and equally distributed over the reaction. For each spectrum, reference values of the monomers and polymer concentration were known and taken into account. The PLS2 algorithm was used and two factors were necessary to account for the variance. This is sensitive as the co-polymer is formed from the two monomers. The R2 (R2 > 0,96) values of the cross-validation attest to the success of the model as shown in Figure 5.
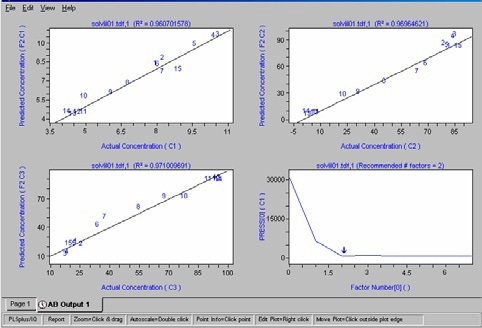
Figure 5. Cross-validation results
Careful inspection of the data set indicates that the two monomers have different conversion rates. Indeed, the intensity ratio of the bands at 1612 cm-1 and 1632 cm-1 attributed to VC2 and ACM respectively is not constant. This important information is then validated by the concentrations profiles derived from the univariate and multivariate analyses shown in Figure 6.
The concentration predictions were performed on spectra of the same reaction that were not part of the training set as shown in Table 2.
Table 2. Concentration predictions not part of the training set
| Time interval betw. the reaction start and the spectrum collection |
%ACM |
%VC2 |
Polymer (arbitraty units) |
| |
Theor. |
Pred. |
Theor. |
Pred. |
Theor. |
Pred. |
| 40 mns |
8,20 |
8,16 |
83,5 |
80,2 |
21,3 |
22,7 |
| 1H40 |
8,64 |
8,68 |
74,3 |
64,8 |
28,6 |
30,2 |
| 3h20 |
0,9 |
1,1 |
3,8 |
2,3 |
91,9 |
88,6 |
This model to a second reaction run for which the spectrum acquisition time was reduced by a factor 2 as shown in Table 3.
Table 3. Model to second reaction run
| Time interval betw. the reaction start and the spectrum collection |
%ACM |
%VC2 |
Polymer (arbitraty units) |
| |
Theor. |
Pred. |
Theor. |
Pred. |
Theor. |
Pred. |
| 50 mns |
10,8 |
6,6 |
80,1 |
88,7 |
31,2 |
35,9 |
| 1H00 |
4,83 |
7,82 |
76,5 |
78,8 |
39,2 |
25,6 |
| 1h45 |
8,3 |
7,92 |
50,9 |
65,9 |
40,3 |
27,8 |
Conclusion
The resulting synergism between Raman spectroscopy and Chemometrics will provide a powerful tool for monitoring and control of manufacturing of polymeric materials.

This information has been sourced, reviewed and adapted from materials provided by HORIBA.
For more information on this source, please visit HORIBA.