Modern Raman equipment is more robust, faster and cheaper than to earlier instrumentation. The developments in component miniaturization have led to the design of high-performance handheld Raman instruments, thus exposing the technology to new areas of applications that were earlier impossible with older and more cumbersome instruments.
Handheld Raman devices like the NanoRam from B&W Tek are ideal choice for pharmaceutical applications, including the testing of raw materials, the determination of counterfeit drugs, and verification of final products, thanks to their extremely high molecular selectivity.
The NanoRam Handheld Raman Spectrometer
The NanoRam is a compact, handheld Raman spectrometer and integrated computing system designed for material identification and verification within facilities that comply with current Good Manufacturing Practices. With a weight of below 2.2lbs, the spectrometer enables developing standardized and validated methods rapidly for purity and quality control applications.
At the heart of the NanoRam is a 785nm wavelength laser excitation source coupled with a thermoelectrically (TE)-cooled CCD detector and a crossed Czerny-Turner spectrograph, delivering a very stable signal with low background noise.
Figure 1 illustrates the dark counts (noise) for a TE cooled spectrometer operated at 18°C and a non-cooled CCD spectrometer at room temperature, at an integration time of 30 seconds, emphasizing the advantages of a temperature-controlled detector in minimizing background noise. The estimated RMS noise level of the TE cooled spectrometer on the right is roughly five times lower when compared the non-cooled unit.
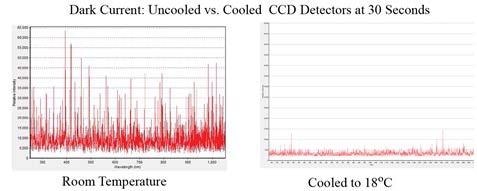
Figure 1. Dark current noise for a non-cooled CCD spectrometer at room temperature (left) and a TE cooled CCD spectrometer at 18°C (right)
The combination of thermoelectric cooling, a high-speed microprocessor, and patented laser stabilization technology enables the Raman spectrometer to deliver laboratory grade performance in a handheld package.
The instrument can produce a signal with high signal to background noise specification that is essential for the successful testing and verification of different food additives and pharmaceutical cellulose compounds.
Characterization of Different Materials and Additives Using NanoRam
Conventional handheld Raman systems have relatively poor selectivity and require extremely long testing times, causing inconsistencies and reliability problems in the testing methods.
Conversely, the NanoRam Raman spectrometer is capable of testing far more complex compounds and differentiating between various binding/tableting materials utilized in the pharmaceutical industry, including cellulose, hydroxypropyl methylcellulose (HPMC), and microcrystalline cellulose.
Here, an analysis was performed using the NanoRam handheld Raman spectrometer to demonstrate the potential of the instrument in differentiating between a group of food additives and cellulose materials.
The materials selected for the analysis included Cellulose (binders/fillers); HPMC (binders/fillers); Lactose (sweetening agent/filler); Maltodextrin (sweetening agent/food additive); Calcium Monohydrogen Phosphate dihydrate (CaHPO4.H2O) (binder/dietary supplement).
Experimental Procedure
Table 1. Handheld Raman operating parameters for the characterization of pharmaceuticals
| Parameter |
Value |
| Laser excitation wavelength |
785 nm |
| Laser line width |
<0.3 nm |
| Spectrometer wavelength range |
175-2900 cm-1 |
| Spectrometer resolution |
9.0 cm-1 @ 912 nm |
| CCD detector type |
Thermoelectric cooled (TEC) linear array |
| Size and number of pixels on detector |
14x200 μm, 2048 |
| Detector TEC temperature |
18 °C |
| Measurement time |
< 20 sec |
Table 1 lists the standard operating parameters utilized for this analysis. the NanoRam is calibrated with pure forms of each of the compounds to develop and record procedures for testing and characterizing all the other materials.
Each device procedure gathers at least 20 scans from the specific type of material, which enables users to incorporate slight differences in packaging materials/ batches, sampling position, and discrepancies associated with multiple operators performing testing.
The customized method for each material also included a proprietary software algorithm to compare and match the Raman spectrum with that in the procedure to create a numerical P-value from which the PASS/FAIL result is identified.
After the development of a method, the total scan time and decision-making process take roughly 20 seconds to perform a PASS/FAIL assessment of a material.
Experimental Results
Figure 2 illustrates a scan that employs this procedure, showing a Raman scan of a cellulose material (blue plot) and the stored ‘Cellulose Method’ created from the reference standard (red plot).
Compared to the unknown sample, the pure cellulose reference material’s Raman spectrum is offset by 1000 intensity units for clarity purposes. Therefore, this unknown sample would be evaluated as a PASS for cellulose.
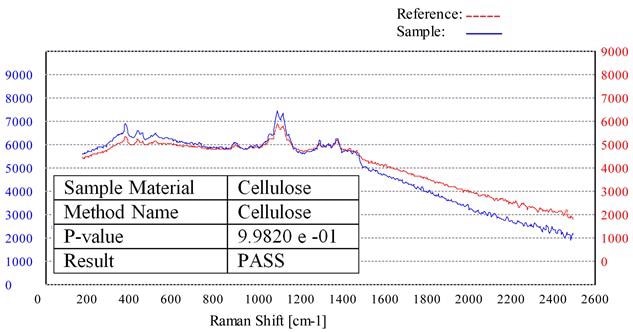
Figure 2. Raman spectrum of a cellulose sample (blue) overlaid with the stored cellulose method (red).
A Raman scan of cellulose utilizing the standard method created for HPMC is depicted in Figure 3, showing the difference between the Raman spectrum for the sample (blue) and the HPMC reference scan (red), as specified by the P- value for the sample. Therefore, this unknown sample would be evaluated as a FAIL for HPMC.
If a sample material has been assessed as a FAIL, the software algorithm facilitates a ‘probable’ assessment of the identification of the material using the library of methods and stored spectral information. This is illustrated in Table 2. Both the cellulose and microcrystalline cellulose PASS the cellulose ID test, while all other materials FAIL the test.
Table 2. Results of all the materials being tested and assessed using the ‘Cellulose Method.’
| Method Name |
CELLULOSE |
| Material |
Identification Result |
P-value |
Probable Match from Investigation |
HQI (%) |
| Cellulose |
Pass as Cellulose |
0.9998 |
Cellulose Confirmed |
| HPMC |
Fail |
7.61E-03 |
HPMC |
99 |
| Lactose |
Fail |
2.26E-03 |
Lactose |
100 |
| Maltodextrin |
Fail |
2.27E-03 |
Maltodextrin |
100 |
| Dihydrate CaHPO4 |
Fail |
4.79E-06 |
Dihydrate CaHPO4 |
100 |
The materials that FAIL the cellulose test are then subsequently assessed against the on-board spectral libraries and validated as the right material with almost 100% accuracy, using the Hit Quality Index (HQI) in the final column.
The HQI nomenclature is known for Raman spectra assessment and is described as the similarity of two spectra in the comparison of a library spectrum with an unknown spectrum through a correlation test.
The average HQI value for all the material that failed a given method test was >99%, denoting that the unknown spectrum matches extremely accurately with a known reference spectrum in the library.
The final part of the analysis was to assess all the powders utilizing specific methods created by each of the pure reference materials. The test results are listed in Table 3, showing that the NanoRam handheld Raman system has correctly corroborated all the materials PASSED their respective methods as represented by the green PASS boxes and all the other materials FAILED the test as represented by the red and brown colored boxes. Each color represents a P-value range as shown in the color legend given below the table.
Table 3. Testing of all the materials under investigation using specific methods generated by each of the pure reference materials
| Method |
HPMC |
Cellulose |
Lactose |
Maltodextrin |
Dihydrate CaHPO4 |
| Materials |
| HPMC |
PASS |
Fail |
Fail |
Fail |
Fail |
| Cellulose |
Fail |
PASS |
Fail |
Fail |
Fail |
| Lactose |
Fail |
Fail |
PASS |
Fail |
Fail |
| Maltodextrin |
Fail |
Fail |
Fail |
PASS |
Fail |
| CaHPO4Dihydrate |
Fail |
Fail |
Fail |
Fail |
PASS |
Color Legend for P-values:
| P-value > 0.05 |
P-value 10- 3 - < 0.05 |
P-value 10-6 - < 10-3 |
P-value 10-15 - < 10-6 |
P-value zero |
Conclusion
The results clearly demonstrate the ability of the NanoRam handheld Raman spectrometer to test and identify the different raw materials and additives utilized in the pharmaceutical and food industries, with a high level of confidence in below 20 seconds.
Additionally, the use of on-board spectral libraries and software algorithms enables a precise assessment of the probable identification of a compound that fails a test, making the spectrometer suitable for the unambiguous identification and corroboration of incoming raw materials in a food or pharmaceutical production environment.

This information has been sourced, reviewed and adapted from materials provided by B&W Tek.
For more information on this source, please visit B&W Tek.