Sponsored by HORIBADec 16 2013
The HORIBA NanoLog spectrofluorometer has been specifically designed for examining single-walled carbon nanotubes (SWCNTs). Now, with the latest inclusions of increased sensitivity and absorbance-measurement capability the NanoLog is even more suitable for SWCNT applications.
Since the length of SWCNT is directly proportional to photoluminescence (PL) intensity and absorbance (A), users can gain a better understanding of the nature of the SWCNT samples. The NanoLog is capable of providing information on metallic SWCNTs, in addition to determining concentrations of semiconducting SWCNTs. Moreover, the increased sensitivity of the NanoLog instrument helps in obtaining a complete PL excitation-emission matrix (EEM) in less than 3 minutes. Figure 1 shows the NanoLog system.
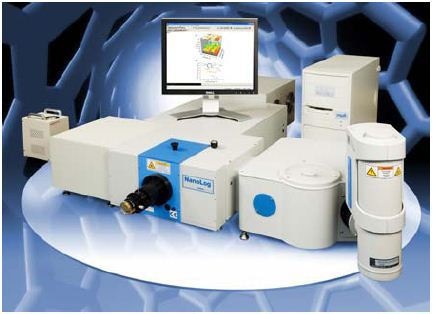
Figure 1. NanoLog system
Measurements of Sample Absorbance
In the experimental study, the SWCNT sample was positioned onto a rectangular cuvette with 0.5cm path-length, and diluted to A ≈ 0.09 at 981nm (Figure 2). Excitation bandpass = 5 nm, with 0.1s integration time/1nm increment; the excitation grating was 1200 grooves mm-1, blazed at 330nm. A Si-PIN diode was used as a detector at room temperature.
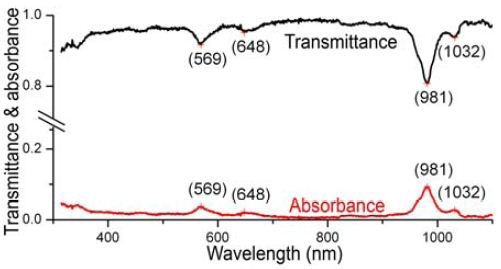
Figure 2. Absorbance (red) and transmittance (black) of NIST SWCNTs, using the new absorbance function of the NanoLog. Prominent peaks are labeled.
Higher S/N and Improved Sensitivity
In order to demonstrate the increased sensitivity of the NanoLog system, (6,5) SG SWCNT (CoMoCAT method) was employed (0.1mg L-1 in D2O, with 0.1% NaDDBs surfactant).The NanoLog features a 1-cm path-length cuvette in which the sample was placed to measure absorbance at 90° to incident light. The NanoLog utilized a Schott RG830 cut-on filter (λ > 830nm) and a 1" In-GaAs 512 × 1 array detector, N2(l)- cooled to 170 K, in the emission path. With × 5s= 10s integration time and 10nm bandpass, the scan was centered at 1210nm. At this stage, the excitation monochromator grating remained the same, and the emission spectrometer grating was 100 grooves mm–1, blazed at 800nm. The new absorption accessory provided A =0.72 at 982nm. Then, photoluminescence from the sample was scanned at λexc = 568nm. Signal (Figure 3) from the enhanced NanoLog system (red) is three times higher when compared to the original instrument (gray).
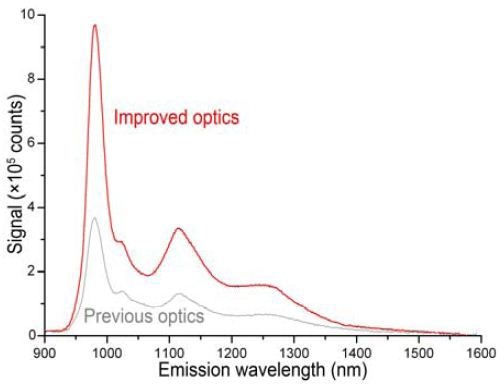
Figure 3. PL signal from the CoMoCat sample de- scribed above. Gray: original NanoLog system; red: improved instrument.
Determination of S/N was analogous to the prior experiment, with the same detector, center wavelength, cut-on filter, bandpass, optical path, gratings, and integration time. In the 0.5cm path-length rectangular cuvette, the SWCNT sample was diluted to A ≈ 0.09 and then scanned from 828 to 1520nm. Calculated S/N = 19 200 from the (6,5) peak and average blank signals. Using the NanoLog and Nanosizer software (Figure 4), an EEM was generated with important peaks (>10% of maximum) labeled. In addition, a helix- angle map of the sample’s components (Figure 5) was produced by the Nanosizer software.
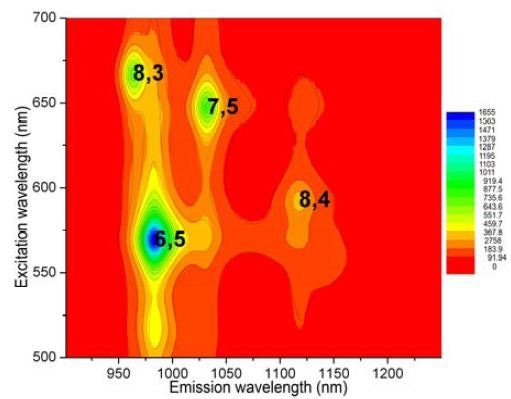
Figure 4. EEM of NIST sample, with SWCNTs (>10% of maximum) labeled using (n,m) coordinates.
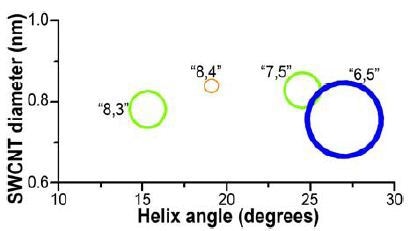
Figure 5. NIST SWCNT diameters vs. helix-angle
Conclusion
For the above experiment, it is evident that the upgraded optics and the new absorbance accessory have further enhanced the HORIBA NanoLog spectrofluorometer, producing more complete characterization coupled with higher S/N, faster throughput, and more signal for SWCNT experiments.

This information has been sourced, reviewed and adapted from materials provided by HORIBA.
For more information on this source, please visit HORIBA.