Information about the secondary and tertiary structure of proteins is obtained by monitoring molecular vibrations using Raman spectroscopy.
Dynamic light scattering or DLS helps in determining the hydrodynamic diameter of biotherapeutic proteins in solution, along with their polydispersity and interactions.
One can determine a large number of structural, chemical and physical parameters by combining these two analytical approaches into a single system. The parameters that can be determined include the following:
- Melting temperature
- Onset temperature of aggregation
- Transition enthalpy values
- Protein secondary and tertiary structure
- Aggregation propensity
- Protein solubility
- Potential for high viscosity at formulated concentrations
This article enumerates the role of Raman spectroscopy in understanding the conformational stability of protein therapeutics.
The Approach
The Zetasizer Helix (ZS Helix) from Malvern Panalytical combines a fiber-coupled Raman spectrometer with a Zetasizer Nano ZSP to provide colloidal stability with DLS and conformational stability with Raman on a single sample.
The hydrodynamic radius of proteins can be measured from 0.15 nm to 5 µm and from 0.1 mg/ mL to ≥ 100 mg/mL using the Zetasizer nano, which combines static or SLS, dynamic or DLS and electrophoretic or ELS light scattering with non-invasive backscatter (NIBS) detector technology.
785 nm excitation (~280 mW) from 150 cm-1 to 1925 cm-1 at 4 cm-1 resolution is done to collect the Raman spectra. Sample aliquots (~120 µL) are placed into a 3mm quartz cuvette and positioned in a temperature-controlled compartment offering temperature control from 0°C - 90°C ± 0.1°C.
By collecting DLS and Raman data over a series of predefined 0.1°C - 5°C step-wise increments, thermal ramp studies are conducted. A series of DLS and Raman data is collected over a pre-defined time interval at a desired temperature set for conducting isothermal incubation studies.
Results and Discussion
Secondary structure characteristics of protein can be determined effectively using Raman spectroscopy. Several secondary structural determination algorithms have been suggested including:
- Band deconvolution of a specifically information-rich spectral feature known as the Amide I band
- Multivariate modeling approach that incorporates a broad spectral range from 990 cm-1 to 1730 cm-1.
From the C=O stretch combined with a small amount of C-N stretch, the Amide I band ~1600 cm-1 to 1700 cm-1 is obtained. From coupling of the C-N stretch to the N-H bend, the Amide III feature, ~1200 cm-1 to 1340 cm-1 is obtained. A band at ~930 cm-1 to 950 cm-1 is based on N-Cα-C skeletal stretching mode, and its intensity is indicative of α- helix content. These features are the key characteristic bands of the protein secondary structure and are summarized in Table 1.
Table 1. Correlation between Raman shift and protein secondary structure.
| Raman Shift (cm-1) |
Protein Backbone |
Secondary Structure Motif |
| 1670-1680 |
Amide I |
ß-Turn/random ß-space |
| 1660-1670 |
Amide I |
ß-sheet |
| 1650-1655 |
Amide I |
α-helix |
| 1330-1340 |
Amide III |
α-helix |
| 1235-1250 |
Amide III |
ß-sheet |
| 930-950 |
Skeletal stretch |
α-helix |
Figure 1 shows representative Raman spectra of Bovine Serum Albumin (BSA) before and after thermal treatment, signifying the major secondary structure features described.
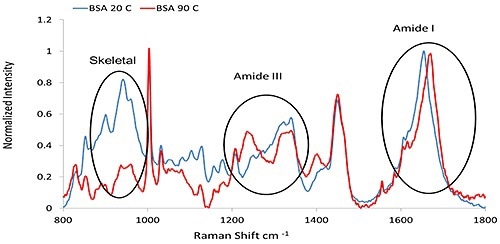
Figure 1. The Raman spectra of BSA (50 mg/mL at pH 7.4, PBS buffer), collected at 20°C and 90°C, respectively.
In a multivariate approach however, the entire spectral profile is considered not just a single Raman band or frequency. Table 2 data show the type of structural information that can be obtained automatically from this model along with comparison to reported values from www.pdb.org.
Table 2. Secondary structural motifs derived from a multivariate analysis of Raman.
| Protein |
PDB File |
Multivariate Model Value |
PDB Value |
|
|
|
α-helix |
ß-sheet |
α-helix |
ß-sheet |
| Concanavalin A |
3CNA |
0 |
46 |
0 |
40 |
| Trypsin |
3RN3 |
18 |
33 |
20 |
35 |
| Lysozyme |
7LYZ |
28 |
8 |
39 |
10 |
| Human Serum Albumin |
1YSX |
69 |
0 |
67 |
0 |
spectra of proteins, as compared to PDB reported values.
α-helical and β-sheet content, predicted via the multivariate model as a function of temperature for the same set of BSA data shown in Figure 1 is compared in Figure 2.
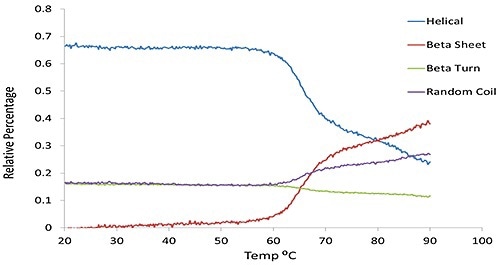
Figure 2. The predicted secondary structural changes derived from multivariate analysis for the same BSA sample shown in Figure 1.
Tertiary Structure
Raman spectroscopy has been used as a probe of protein tertiary structure and is also highly sensitive to the symmetrical vibrational modes of the aromatic side chains, i.e. phenylalanine (Phe, F), tyrosine (Tyr, Y) and tryptophan (Trp, W).
Collates the dominant tertiary structure band assignments, and their corresponding structural indications shown in Table 3.
Figure 3 clearly shows how with an increase in temperature, the secondary structure (green circles), changes from α-helix abundant to β-sheet rich structure and also α-helix drops from 40% to 18%, and β-sheet increases from 6% to 28%.
Table 3. Summary of the common aromatic markers used for protein tertiary structure.
| _1 Raman Shift (cm ) |
Source |
Structure Indication |
| 1360/1340 >1 |
Trp Fermi Doublet (W7) |
Indole ring in hydrophobic environment or in contact with aliphatic chains |
| 1360/1340 <1 |
Trp Fermi Doublet (W7) |
Indole ring in hydrophilic environment or exposed to aqueous medium |
| 1550 |
Trp dihedral angle (W3) |
The angle between the indole ring and the peptide bond plane |
| 870-885 |
Trp hydrogen bonding (W17) |
883 non H-bonded
877 medium strength
871 strong H-bonded |
| 760 |
Trp (W18) |
Cation-n interaction |
| 850/830 ~ 0.25 |
H-bonding of Tyrosine |
Donor of strong H-bond |
| 850/830 ~ 1.25 |
H-bonding of Tyrosine |
Donor and acceptor of strong H-bond/exposed to aqueous environment |
| 850/830 ~ 1.25 |
H-bonding of Tyrosine |
Acceptor of strong H-bond/buried tyrosine |
| 1002-1004 |
Phe ring breathing mode |
Normalize the Raman intensity |
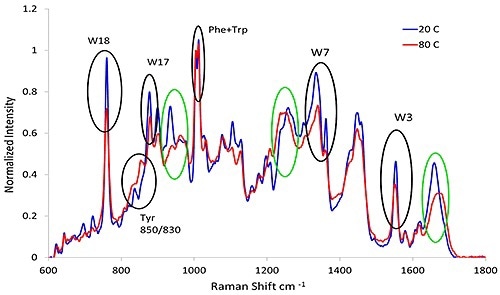
Figure 3. Representative spectra from lysozyme at pH 7.4 before and after heat treatment. The black circles indicate the aromatic markers as shown in Table 3 and the green circles refer to the secondary structure described in Table 1.
Disulfide Bond
The disulfide bond is a covalent bond between sulfur units on cysteine residues, and is crucial for maintaining the native protein structure. Table 4 shows three unique disulfide bond conformers.
Table 4. Summary of disulfide bond conformers in Raman spectra.
| Raman Shift (cm-1) |
Source |
Structure Indication |
| 508-512 |
S-S stretch |
GGG conformer |
| 523-528 |
S-S stretch |
GGT conformer |
| 540-545 |
S-S stretch |
TGT conformer |
The disulfide region of lysozyme or four total disulfide bonds before and after thermal treatment are shown in Figure 4. It can be seen from the 508 cm-1, 528 cm-1, and 545 cm-1.
Bands at 20°C that the lysozyme disulfide bonds have character assigned to the gauchegauche- gauche (GGG), gauche-gauche-trans(GGT) and trans-gauche-trans(TGT) conformers. It can be observed that at 80 °C, the peaks at 528 cm-1 and 545 cm-1 have disappeared, showing that only the GGG conformer still remains.
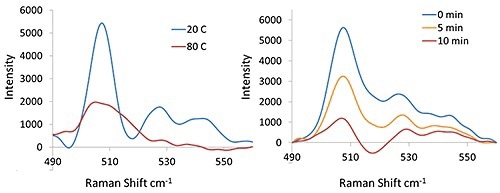
Figure 4. Raman spectra (disulfide spectral region) of lysozyme at 20°C and 80°C (Left) and the lysozyme sample at 40°C (Right) with DTT (50mg/mL protein with 50 mM DTT).
Additional Raman Spectra - Protein Structure Applications
In protein therapeutics, Raman spectroscopy has significant promise. It helps in sampling, ruggedness and selectivity and a number of future applications are possible such as forensic particle identification (silicone oil droplets, glass, etc); protein structural determination at interfaces (wateroil, gold nanoparticles); protein dynamics (H/D exchange); accelerated degradation (thermal, reducing agent, agitation and oxidization), and many others.
Conclusions
Combining DLS and Raman spectroscopy into a single instrumental platform offers unique analytical capabilities to determine protein secondary and tertiary structure, melting temperature, size and onset of aggregation for the same sample without altering the testing conditions.
This article enumerates the unique spectra-structure properties that may be correlated using Raman Spectroscopy. Also DLS was used to derive the bulk viscosity/ restricted diffusion interaction parameter (kD), particle interaction parameter (B22), melting temperature, onset temperature of aggregation and transition enthalpies as indices of formulation stability.

This information has been sourced, reviewed and adapted from materials provided by Malvern Panalytical.
For more information on this source, please visit Malvern Panalytical.