For parenteral administration biopharmaceuticals, protein aggregate formation poses a problem due to the possibility of increased immunogenicity. Hence, regulatory agencies demand manufacturers to monitor and reduce the levels of sub-visible particles found in the therapeutic protein from production through their whole shelf life.
Although different mechanisms can induce immunogenicity, contamination by non-protein material is a major cause. Besides protein aggregates, non-biological contaminants may serve as nucleation points for the growth of aggregates. Therefore, particle sizing data alone is not enough.
Resonant Mass Measurement (RMM) technology in the Archimedes system quantifies the buoyant mass of particles traversing a cantilever. In this way, the particles that have a different density from the buffer solution can be detected.
As a result, the Archimedes system enables differentiating between positively buoyant particles, such as silicone oil, and negatively buoyant particles, such as proteins (Figure 1).
This article discusses the application of the Archimedes system to determine and measure the introduction of silicone oil droplets and formation of protein sub-visible particles in response to shear stress.
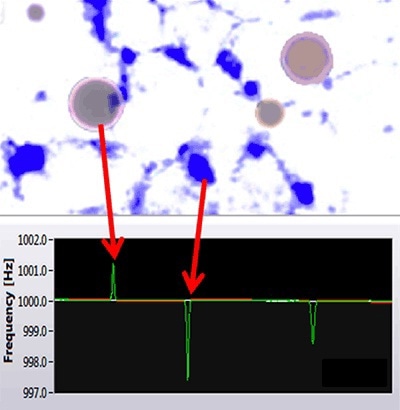
Figure 1. Archimedes can distinguish between silicone oil and protein aggregates.
Experimental Procedure
Bovine Serum Albumin (BSA) solution of 20mg/mL concentration was prepared in pure water and filtered using a 0.2 µm syringe filter. Sample analyzes were performed before and after the application of shear stress. Shear stress was applied by repeatedly injecting the BSA solution through a 2 mL syringe coupled with a grade-23 needle.
A micro sensor in the Archimedes Resonant Mass Measurement (RMM) system was used to perform the analysis. The microsensor was subjected to pure water rinsing and calibration using 1µm latex beads and deuterium before running samples. Sample run was performed using a specified volume of 0.1 µL and a limit of detection of 0.02 Hz.
Experimental Results
Impact of Shear Stress on Protein Aggregates Formation
The RMM was used to measure sub-visible particles before and after the application of shear stress and the results are presented in Figure 2. Before the syringe-induced stress, the Archimedes system detected only very few particles, meaning that the solution was reasonably pure with a less number of large protein aggregates.
This result illustrates the low noise baseline of the Archimedes system, facilitating accurate analysis of pure samples. Following syringe-induced shear stress, the count of particles detected by the Archimedes system increased drastically, with a particle size range of 500 – 1700 nm.
The particle size distribution provides key insights pertaining to the response to the type of stress induced. This information is useful in the comparison of different stress conditions to better understand the degradation profile for the biopharmaceutical of interest.
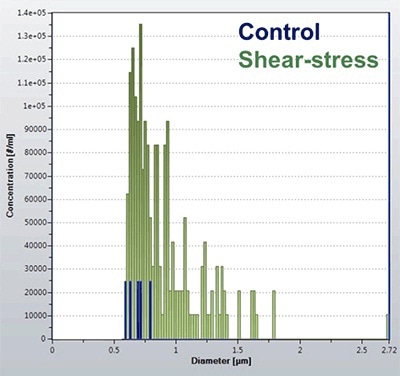
Figure 2. Quantification of protein aggregates in response to shear stress.
Gaining knowledge on the effect of bioprocessing on protein characteristics is crucial to better understand products and design production parameters. The compatibility level of biopharmaceuticals varies with materials utilized in the manufacture of product contact components, depending on individual protein and formulation characteristics, as well as extractables and leachables.
For that reason, it is necessary to compare the impact of product contact components. Figure 3 presents the comparison results of sub-visible particles formed by shear stress of two different syringe manufacturers, showing that the compatibility of the protein is more with syringes from manufacturer 1 (red bars) compared to those from the manufacturer 2 (blue bars).
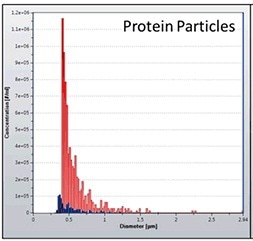
Figure 3. Quantification of protein aggregates from syringe manufacturer 1 (red) and 2 (blue).
Detection and Quantification of Silicone Oil
Figure 4A presents the positive mass data obtained from the previous analysis, demonstrating the existence of silicone oil from the two syringes analyzed. As can be seen in Figure 4B, protein aggregates make a negative frequency shift, whereas silicone oil produces a positive frequency shift. The Archimedes system facilitates measuring silicone oil content, which can negatively affect the protein itself, and/or increases immunogenicity subsequent to administration.
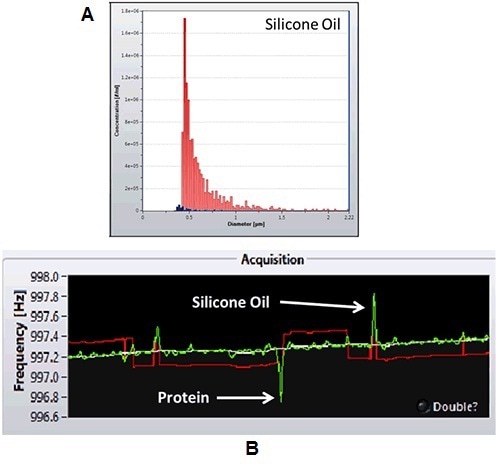
Figure 4. A. Quantification of silicone oil from syringe manufacturer 1 (red) and 2 (blue). B. frequency shifts induced by protein and silicone particles.
As observed in Figure 4, higher levels of silicone oil are introduced into the protein sample by the syringes from manufacturer 1 (red bars) subsequent to repeated shear stress.
The higher levels of silicone oil might be the reason for the more number of protein aggregates detected with this syringe. With the ability to determine and measure silicone oil content, the Archimedes system is helpful in gaining more insights into the product as well as the relevant degradation pathways.
Conclusions
The results demonstrate that the Archimedes RMM system is capable of detecting and quantifying protein aggregates and silicone oil in response to shear stress, providing valuable data about biopharmaceutical products to better understand bioprocessing impact, immunogenicity, and product stability.

This information has been sourced, reviewed and adapted from materials provided by Malvern Panalytical.
For more information on this source, please visit Malvern Panalytical.