In protein formulations, native-state unfolding and aggregation holds major significance for both patients and manufacturers. A better understanding of aggregation is therefore required for improve product quality and reduce safety concerns, along with careful monitoring for long-term issues related to formulation stability.
The combination of dynamic light scattering (DLS) and Raman spectroscopy is suitable for investigating protein aggregation. In Raman spectroscopy, information about protein unfolding is derived by monitoring the modifications in molecular vibrations which take place as the result of changes in the secondary and tertiary structures of protein.
On the other hand, DLS is a technique which can be used in order to determine the polydispersity of a sample, the hydrodynamic radius of a therapeutic protein in solution as well as sample interactions.
Protein Unfolding/Aggregation Pathways
By integrating these two analytical techniques into a single system, a range of physical, structural and chemical parameters can be determined. Secondary and tertiary structure of protein, onset temperature of aggregation (Tonset), melting temperature (Tm), transition enthalpy values, protein solubility, aggregation propensity, and the potential for high viscosity at formulated concentrations can be derived.
The results obtained from Raman spectroscopy and DLS on the same sample may give unique insights into the mechanisms of unfolding and aggregation.
Zetasizer Nano System
In order to obtain simultaneous Raman and DLS measurements, the Zetasizer Helix (ZS Helix) from Malvern Panalytical integrates a Zetasizer Nano ZSP with a fiber-coupled Raman spectrometer to provide Raman (conformational stability) and DLS (colloidal stability) data in sequence on a single sample.
The Zetasizer Nano system combines non-invasive backscatter (NIBS) detector technology with electrophoretic (ELS), static (SLS), and dynamic (DLS) light scattering to determine proteins’ hydrodynamic radius from 0.3 nm to 10 µm, at concentrations ranging from 0.1 mg/mL to 100 mg/mL, or more.
Using 785 nm excitation (~280 mW) from 150 cm-1 to 1925 cm-1 at 4 cm-1 resolution, Raman spectra are collected and using a quartz cuvette with a 3 mm pathlength, sample aliquots (~120 µL) are introduced within the temperature-controlled sample compartment. The temperature of the sample compartment can be set from 0°C to 90°C ± 0.1°C.
Thermal ramp studies are then performed by collecting DLS and Raman data in a sequence of predefined temperature increments, whilst isothermal incubation experiments are carried out by collecting DLS and Raman data at a low temperature, rapidly increasing the temperature, and collecting various DLS and Raman data at the higher temperature over a long period of time.
Raman Spectroscopy
Raman spectroscopy provides an effective method to ascertain the secondary and tertiary structural characteristics of protein. A wide range of secondary structural markers, including a-helix backbone (930 cm-1 - 950 cm- 1), amide I (1600 cm-1 - 1700 cm-1), and amide III (1200cm-1 - 1350cm-1) can be monitored.
Raman spectroscopy is very sensitive to the vibration modes of the aromatic side chains, such as tryptophan, tyrosine and phenylalanine. As a result it has been extensively used to probe of protein tertiary structure.
A number of well-established Raman markers provide insights into the environment of these aromatic side chains, including tyrosine at 1550 cm-1 and tyrosine at 850 cm-1. Changes in these areas imply a change in the hydrophobic or hydrophilic environment of the side chain, which is typical of unfolding.
Since Raman spectroscopy has the ability to elucidate the structural changes of protein, it is suitable for studying unfolding proteins. When proteins are exposed to thermal stress, they unfold and aggregate. Figure 1 shows the Raman spectra from the lysozyme sample, which was subjected to thermal stress at 20°C (blue line) and 80°C (red line).
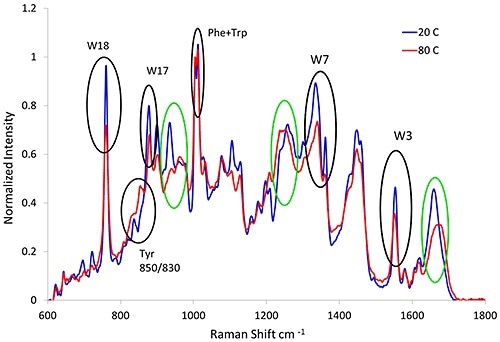
Figure 1. Raman spectra of lysozyme before (blue line) and after (red line) heat treatment. Variations in the secondary (green circles) and tertiary (black circles) structural markers are observed as a result of thermal stress.
Dynamic Light Scattering
Historically, DLS was used for determining the hydrodynamic radius of proteins in solution but now with the inclusion of backscattering detection, the size of proteins in solution can be detected. Besides size measurements, DLS provides information about the sample’s polydispersity or size distribution and can be utilized to quantify Tonset.
Due to its sensitivity to size, DLS is perfect for detecting tiny amounts of large aggregates in solution. Results from a bovine serum albumin (BSA) thermal ramping experiment are shown in Figure 2.
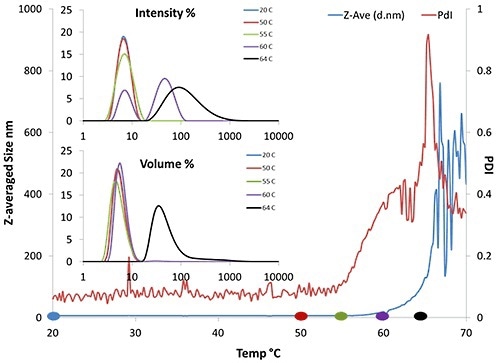
Figure 2. DLS thermal ramping data of 50mg/mL BSA. Results include Z-average size, PDI, and volume and intensity distributions.
In Figure 2, the Z-averaged size trend (blue line) denotes that Tonset is ~62°C. The intensity and volume distributions (inset) show that as the temperature increases, the amount of larger particles detected by the instrument also increases. In particular, there is an increase in larger particles at about 60°C (purple line, inset).
These increases indicate that aggregates are starting to form. In addition, the polydispersity begins to increase at 55°C, signifying that aggregation is starting to occur at that temperature.
Combination of DLS and Raman Spectroscopy
The combination of DLS and Raman leads to a method which is suitable for monitoring protein unfolding and aggregation pathways. For example, to study the correlation between protein unfolding and aggregation, formulations of BSA in citrate buffer at different pHs were used.
Samples were produced at 50mg/mL concentration at pH = 4.7, 5.4, and 7.1. For each sample, the transition temperature (Tm) was determined by performing ramping experiments. Following this, samples were incubated just below their Tm where unfolding should be the desired state but occurs slowly.
Figure 3 shows the representative results for the isothermal incubation study.
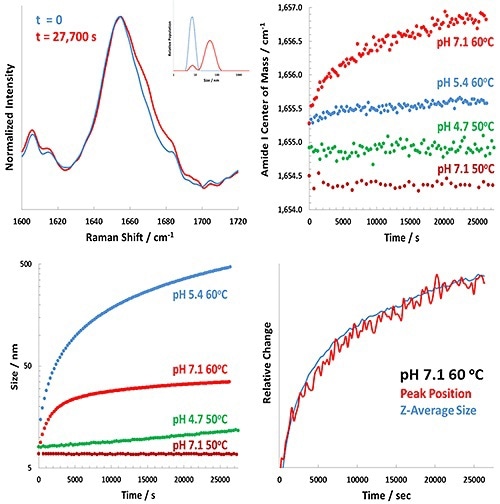
Figure 3. Representative results for the Raman-DLS study of BSA at various pH values.
The upper left panel of Figure 3 reveals the extent of change in the pH 7.1 BSA sample at 60°C incubation between t = 0 (blue) and t = 7.8 hours (red) for both the DLS results (inset) and the amide I band.
The upper right and lower left panels show the complete analysis of the Raman (amide I) and DLS data, respectively. The study demonstrates considerable pH-dependence in the behavior of both BSA unfolding and aggregation.
In the lower right panel of Figure 3, the Z-averaged size and the time-dependence of the amide I band are overlapped. This plot shows that the size and structural changes closely track one another. It also indicates that the protein’s structural unfolding tracked by Raman spectroscopy results in a larger BSA monomer, with slight aggregation of the BSA occuring.
A different picture is revealed by observing the results at pH 5.4, when the structural changes in the protein are extremely small (~0.25 cm-1 change after 7.8 hours) but the size changes are considerably larger (greater than 500 nm after 7.8 hours).
The pH 4.7 results show a slight change in size at 50°C and no perceptible change in structure. The protein appeared to precipitate immediately at 60°C above Tm for BSA at pH 4.7. This matches expectations near pI, as aggregates are free to form and charge repulsion of protein monomers is not present.
Combined DLS/Raman spectroscopy provides insight into how access to size as well as structural data can be utilized to better understand processes of interest to the bioanalytical community.
Conclusion
By combining DLS and Raman spectroscopy into a single system, protein size and structural changes from a single sample can be determined. Raman spectroscopy, with its ability to monitor protein structural changes, is a good indicator of protein unfolding and potentially aggregation, and DLS, with its ability to determine protein size changes, is also a good indicator of protein aggregation. Together, these analytical approaches can provide a better understanding about the unfolding and aggregation pathway, delivering significant characterization information.

This information has been sourced, reviewed and adapted from materials provided by Malvern Panalytical.
For more information on this source, please visit Malvern Panalytical.