The Process Analytical Technology (PAT) initiative of the FDA helps pharmaceutical companies to improve the production process and consistently deliver products of better quality. For this purpose, it is essential to have instruments capable of monitoring pharmaceutical unit operations in real time to gain insights and control key process parameters. The ideal tool is Raman spectroscopy, which is capable of performing real-time, non-invasive data acquisition from the process line with little or no sample preparation.
This article discusses the application of Raman spectroscopy to observe the homogeneity of granules of solid pharmaceutical dosage forms before tablet compression.
Experimental Procedure
In this experiment, Kaiser Optical Systems’ RamanRxn™ analyzer equipped with a non-invasive Raman PhAT probe was used to collect the Raman spectra during process-validation runs. The blend uniformity of granules prior to tablet compression was monitored by the Raman PhAT probe secured in a Teflon holder. The sample size for each spectrum was140mg of granules, which is comparable to the standard dosage volume of 160mg.
Raman spectra were continuously collected during tablet compression using an exposure time of 30s with two accumulations. The time for obtaining a uniform mixture was identified using the mean square of differences (MSD) between two successive Raman spectra. Raman analysis of laboratory samples was performed to determine the quantitative blend uniformity with a two-component partial least-squares (PLS1) calibration model (RMSEC = 0.43, RMSECV = 0.52).
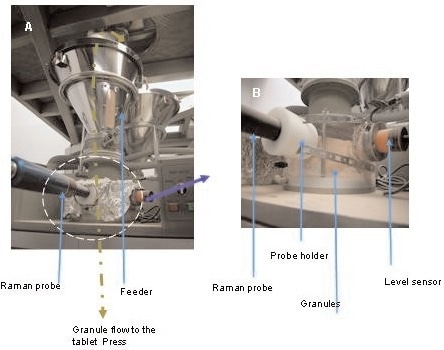
Figure 1. A) The non-contact Raman PhAT probe in its interface with the feed frame on the tablet press. B) Enlargement of the non-contact Raman PhAT probe and the level sensor. (© 2006 Russell Publishing).
Experimental Results
In this analysis, the comparison of the blended powder uniformity data and tablet content uniformity data was performed using the Raman data. After collecting the samples, HPLC was used as standard assay method to corroborate the Raman data. The MSD profiles revealed the formation of a homogeneous mixture after blending for 15 minutes. These results were confirmed by the HPLC analysis.
Figure 2 shows the predicted API content in the granules that were transferred from the hopper to the feed frame in the course of tablet compression. The predicted API in the granules during continuous tablet compression with a multivariate calibration model was 3.13% (RSD = 2.38%), which is consistent with the API’s nominal concentration in the blend of 3.125%.
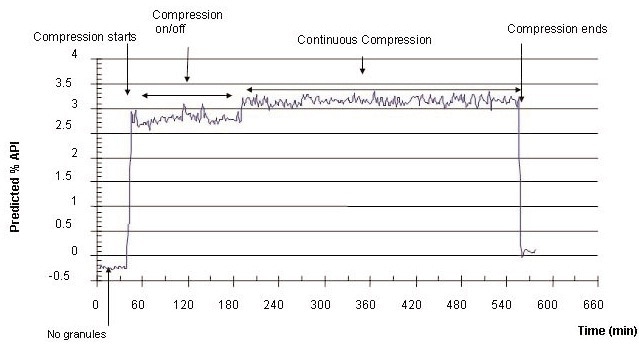
Figure 2. Predicted content of API in granules during tablet compression (nominal value is 3.125%). (© 2006 Russell Publishing).
The Raman data and HPLC data correlated by sampling time were consistent with each other. For instance, the mean potency of granule blend uniformity measured by Raman was 100.5% (RSD = 2.3%). Similarly, the mean potency of tablet content uniformity at 40% tablet compression from the HPLC analysis was 103.2% (RSD = 1.2%). The relative standard deviation of the Raman analysis of blend uniformity is slightly higher (2–3%) when compared to the content uniformity measured by HPLC (1–2%). The reasons include:
- Possibility for some variation in the Raman tool.
- Raman analyses might have been affected by the physical properties of the granules and the existence of excipients in a different manner when compared to the UV detection of the isolated API content in the HPLC analyses.
- There may be differences in the sample volumes and effective API concentrations between the Raman and HPLC samples.
The compression start and end time, and continuous and non-continuous compression time periods can be isolated using the Raman data (Figure 2).
Conclusion
The study results illustrate the capability of Raman spectroscopy to perform in-line monitoring of the pharmaceutical blending processes. The selectivity of Raman spectroscopy enables determining most of the species in pharmaceutical formulations, making it ideal for detecting unwanted process deviation in the course of tablet compression. Moreover, a properly mounted Raman analyzer can monitor and control unit operation in real time to obtain a quality product that is in good agreement with off-line QC testing. The combination of RamanRxn analyzer and PhAT technology can monitor pharmaceutical unit operations in real time with little or no sample preparation.
About Kaiser Optical Systems
Kaiser Optical Systems, Inc. is a world leader in spectrographic instrumentation and applied holographic technology. Principal products include Raman sensors and instrumentation, advanced holographic components for spectroscopy, and astronomy and ultra-fast sciences. Principal offices and the manufacturing facility are located in Ann Arbor, Michigan.
Their products and services are deployed throughout the world in such diverse applications as pharmaceutical and chemical manufacturing, nanotechnology, telecommunications, education, forensic science, deep-sea exploration, and astronomy. From particles smaller than a human hair to objects as large as planets, their products are providing their customers unique insights into both today’s as well as “age-old” questions.
Kaiser was founded in 1979 to meet the need for diffractive or holographic optics for the avionics market. Kaiser entered the spectroscopy market in 1990 with the introduction of the holographic notch filter. In 1993 Kaiser released their first Raman analyzer, the HoloProbe. In 2013, the company became part of the Endress+Hauser Group.
To better serve the European community, Kaiser opened a new subsidiary in Europe in 1998. Kaiser Optical Systems SARL is located in Lyon, France. Kaiser SARL supervises their distributor network within Europe.

This information has been sourced, reviewed and adapted from materials provided by Kaiser Optical Systems.
For more information on this source, please visit Kaiser Optical Systems.