In cases of extremely large samples and those that have a distribution of object sizes from the micro to the nano-scale, detailed surface analysis is definitely a challenge. This is particularly true when there is limited time for the analysis.
There may be misrepresentation of the structural and chemical composition while obtaining elemental maps at low magnifications by traditional analysis at relatively low pixel density can misrepresent the chemical and structural composition.
This holds true in fields such as archaeology, geology, and materials science where samples are frequently of unknown morphology and chemistry and where micro-and nano-structure is highly significant.
This article covers how AZtecEnergy Large Area Mapping can be implemented as a research tool for improving surface characterization levels with respect to chemistry and phase distributions at the same time reducing effort and time spent.
High Resolution Large Area Map – From Micro to Nano
As an attempt to imitate traditional processes for copper metal extraction smelting experiments were done on samples of chalcopyrite. The focus of this research is to establish and understand the distribution of small copper metal prills formed from the ore smelting process and to precisely verify their purity.
If there is a strong concentration of copper metal, it means that the smelting experiment was successful. If silicaceous slag is absent, then it would mean that the non-slagging experimental ore reduction was successful.
Precise elemental maps and PhaseMaps of the iron and sulphur regions could be used to emphasize the technique of copper metal formation. Using AZtec Large Area Mapping, all this data can be gathered simultaneously in a single automated operation on a large polished sample area. The data can also be used for an in-depth analysis offline.
In order to cover the whole sample (5x3mm), about 900 individual electron image and X-ray spectral map datacubes were gathered in a grid pattern using an X-MaxN 80 mm2 SDD detector and AZtecEnergy Large Area Mapping software.
This enables the entire sample structure to be viewed and at the same time, the high resolution of each individual field is maintained. AZtec automatically aligns and ‘montages’ the 900 fields together to create a single individual area containing all the electron image and X-ray spectral data.
These montaged areas were then used to analyse the sample at a micro- and nano-scale to locate and study the distribution of the copper and other minerals (Figure 1). The red regions indicate copper-rich minerals and metal.
It is clear that the metal was extending out into the porosity of the bulk structure as it cooled from the smelting process, thereby forming copper metal prills (Figure 1 inset). Also, the original chalcopyrite ore was quite homogenous and pure, so the large intrusive silica grains (in light brown) within the matrix indicates that the reaction product was in the molten state and the silica became fused in- situ.
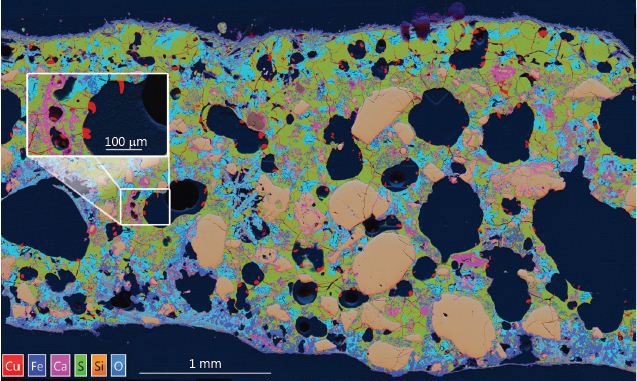
Figure 1. X-ray map produced by combining 900 individually collected fields. The multi-coloured ‘Layered Image’ shows large silica grains (brown) and porosity (black) and Cu (Red). The area analysed is 5x3 mm with a pixel density of 10,000 by 6,000.
Phase Map Analysis
By converting the X-ray maps into Phase maps using AZtec AutoPhaseMap reveals the constituent elements of the mineral phases in a clear manner as well as the distribution of phases over the whole specimen (Figure 2A).
The Phase maps pinpoint two specific regions clearly, which developed after the smelting process. They are copper-iron sulphide with enriched copper, and iron sulphide with minimal copper (Figure 2A).
The original fairly homogenous chalcopyrite ore mineral seems to have reduced in size and revealed that the copper metal prills were forming only in the interfacial regions consisting of copper sulphide, which really is the ‘feeder’ reaction zone on the copper-rich mineral phase, and not in areas consisting of iron sulphide.
The chemical reactions by which elemental copper is obtained may have been in the molten matte, and the entrapped silica grains reveal that it was definitely molten. The microstructure of the copper prills is indicative of the fact that the copper is cooling gradually from the reaction products, thereby providing it time to form on the inner surfaces of gas porosity regions of the solidifying matte.
The copper prills are not in a dendritic or globular form as expected if they had solidified from molten metal at above 1085ºC, but appear to be formed by nucleation process and growth in the solid state producing the linear surface characteristics (Figure 2B inset). The acceptable temperature for these characteristics would be in the region of 950-1000ºC (Dutrizac 1976).
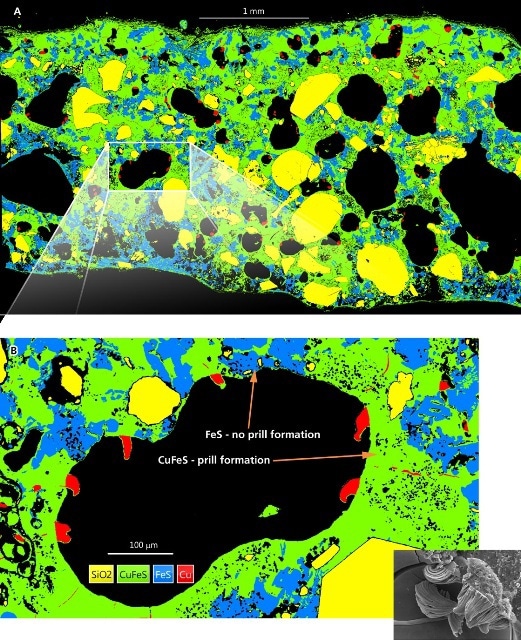
Figure 2. AutoPhaseMap generated from the montaged 900 datacube maps. The phases of SiO2 (yellow), CuFeS (green), FeS (blue) and Cu (red) were automatically identified and separated. Analysis shows that throughout the entire sample the copper ‘prills’ preferentially formed away from the Iron rich regions. Figure 2B (inset), fractured sample of the reaction products showing copper prills growing from the internal surface of a gas pore, but with no ‘roots’ within the matrix. (SEM micrograph Nigel Meeks).
Quantitative Offline Re-Analysis
To test the purity of the copper metal regions, it was possible to rebuild spectra from any point within the montaged image. Despite the original data being gathered in a very brief process time and high count rate (200,000cps), which is ideal only for fast X-ray mapping, the data quality was not affected (Figure 3 and Table 1).
Any artefacts due to high count rate such as pulse pile-up were modified, thus allowing precise quantitative composition output to be collected. These quantification analyses identified that the copper metal regions had an average composition of Cu 99% with Fe 1%, which matches with previous data [Craddock et al 2007, Craddock and Meeks 1987].
This proved that the copper metal was completely decreased and its relative purity matches the microstructural observations that the prills probably did not form from molten copper - as it would most likely have dissolved more impurities (Percy 1861).
It is also obvious that the FeSCu phase is nearer to a bornite composition than chalcopyrite. The copper/sulphur ratio is 1:1 rather than 0.5:1 of the chalcopyrite ore, and hence this phase is an intermediate reaction product that has been enriched in copper, and lost some iron and sulphur to the adjacent FeS phase. This is constant with the position of the copper prills, which are only found attached to the copper enriched mineral phase.
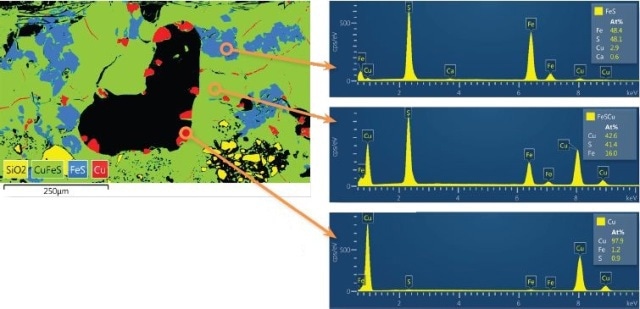
Figure 3. Magnified area of montaged image showing the copper prills (red), iron sulphide reaction product (blue), and chalcopyrite ore (green) with reconstructed spectra and atomic composition quantification (Full Quant results in Table 1 on the next page). Pulse pile-up has been automatically accounted for to give reliable results, despite the high count rate used for data acquisition.
Table 1. Accurate quantitative results reconstructed from the stored montage image showing depleted copper mineral FeS, the copper metal deposits and copper-rich ore. At 99% Cu with only 1% Fe, it suggests the copper underwent a full reduction process during smelting.
| FeS |
Wt% |
Wt% Sigma |
Atomic% |
| Fe |
60.75 |
0.12 |
48.45 |
| S |
34.63 |
0.11 |
48.1 |
| Cu |
4.09 |
0.10 |
2.87 |
| Ca |
0.53 |
0.03 |
0.59 |
| Total |
100 |
|
100 |
| Cu |
| Cu |
98.47 |
0.08 |
97.89 |
| Fe |
1.06 |
0.06 |
1.20 |
| S |
0.46 |
0.06 |
0.91 |
| Total |
100 |
|
100 |
| FeSCu |
| Cu |
54.95 |
0.11 |
42.61 |
| S |
26.96 |
0.08 |
41.43 |
| Fe |
18.09 |
0.08 |
15.96 |
| Total |
100 |
|
100 |
Conclusion
Using AZtec Large Area Mapping to analyse the Chalcopyrite smelting products was a valuable means to handle large sample size while still maintaining the high resolution required to study large (mm) and small (mm) scale distributions.
By gathering the data in a single automated operation and performing the in-depth analysis off-line, valuable microscope time was saved. Aztec AutoPhaseMap results identified trends in the formation of the copper which only formed in regions rich in CuFeS rather than FeS, this was proof to indicate the temperature used during the smelting process (Dutrizac 1976).
Reanalysed spectra from many regions showed that the copper metal had a very high purity (~99%) which meant it underwent a full reduction process during smelting and was not co-deposited with any other metals. These results emphasize that AZtec Large Area Mapping can be a highly effective research tool for the study of large complex samples.

This information has been sourced, reviewed and adapted from materials provided by Oxford Instruments NanoAnalysis.
For more information on this source, please visit Oxford Instruments NanoAnalysis.