Microstructural analysis, such as grain size and boundary determination, and quantitative analysis of crystallographic orientation, can be carried out using EBSD (Electron BackScatter Diffraction).
EBSD differentiates between different crystalline phases on the basis of differences in crystallographic parameters within the sample. This means that if different phases within a sample have similar crystal structures it can be difficult to differentiate between them using only EBSD. In these cases, it can be useful to combine EBSD with a technique that differentiates based on chemical differences, such as EDS (Energy Dispersive Spectrometry).
The TruPhase tool, in the AZtec® from Oxford Instruments, allows differences between phases of extremely similar crystal structures to be seen by taking account of chemical differences. TruPhase takes both EDS and EBSD measurements from the sample and in instances where the electron backscattered pattern (EBSP) is not conclusive the EDS data can be used to rank the EBSD data.
TruPhase can be ran during the collection of EBSD data with no impact on the duration of the experiment. In addition, TruPhase can also be ran following data collection or on saved data sets.
Ni Superalloy
This article will explore the analysis of a Ni-based superalloy to demonstrate this method. Ni-based superalloys are heavily utilized in the aerospace sector, where they are used in turbines, meaning they must have excellent temperature performance and a high yield strength.
Precipitation hardening is used to produce secondary phase precipitates through the addition of alloy elements, which increase the yield strength and provide the required high temperature performance.
Characterising the second phases is essential in understanding this precipitation hardening mechanism and EBSD is used to investigate and identify these precipitates.
The sample in this example has a complex microstructure that has a nickel matrix with a number of different secondary phases embedded within it. These include rounded Nb/Ti carbonitride precipitates and pervasive needle-like Nb-rich δ precipitates (Figure 1a).
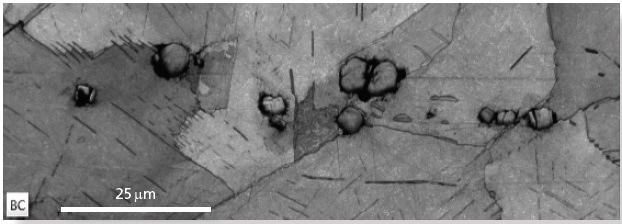
Figure 1a. An EBSD band contrast map, illustrating the nickel matrix coupled with the needle-like Ni-Nb precipitates and the rounded carbonitrides. Image Credit: Oxford Instruments
The δ phase can be differentiated from the nickel surrounding it using only EBSD, however the carbonitride region is of high crystallographic similarity to the nickel – they have similarly sized unit cells, both have FCC structure and are in the same space group (225, see Table 1). These similarities make it hard to differentiate between them using only EBSD (Figure 1b).
Table 1. Crystallographic properties of the phases in the superalloy. Phases that are highlighted in blue are difficult to differentiate by EBSD alone. Source: Oxford Instruments
| Phase |
Space Group |
Unit cell parameters |
| Ni |
225 (cubic) |
a = 3.57Å |
| Ni3Nb |
59 (orthorhombic) |
a = 5.12 Å, b = 4.26 Å, c = 4.57Å |
| Nb carbide |
225 (cubic) |
a = 4.46 Å |
| Ti nitride |
225 (cubic) |
a = 4.24 Å |
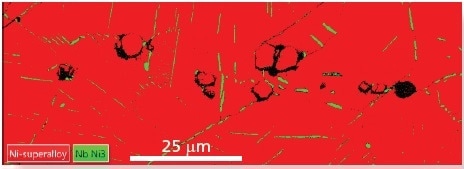
Figure 1b. A standard EBSD phase map solved against the two phases Ni and d-Ni3Nb. Although the matrix and d-phases are readily distinguished, many of the carbonitrides index as Ni. Image Credit: Oxford Instruments
Whilst these phases have similar crystal properties, they have different chemistries. Taking an X-ray image shows that the carbonitrides have higher Nb and Ti concentrations, and a lower Ni concentration; whereas the needle-like precipitates have higher Ni and Nb concentrations (Figures 1c, d, e). These chemical differences can be seen using TruPhase.
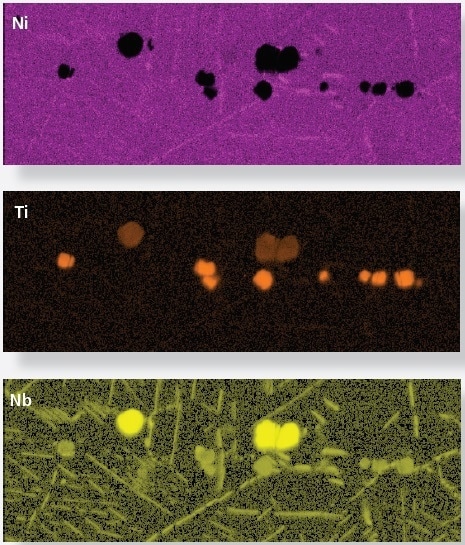
Figure 1c, d, e. Ni, Nb and Ti X-ray maps show relative concentration of Ni, Nb and Ti. Image Credit: Oxford Instruments
AZtec TruPhase
A reference spectrum was collected from the nickel matrix and each of the Ti/Nb carbonitrides and the EDS and EBSP measurements were then taken simultaneously.
At points where the EBSD data suggests more than one possible phase the EDS data and the reference spectrum are used to rank the possible solutions, and this ranking is used to determine the correct EBSP solution. This means that phases of similar crystallographic properties can be accurately differentiated (Figure 1f).
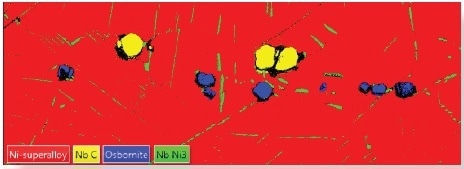
Figure 1f. The application of AZtecTruPhase enables an accurate identification of the phases in the Ni superalloy. Image Credit: Oxford Instruments
Conclusion
AZtec provides users with the powerful combination of EBSD and EDS, meaning even crystallographically similar phases can be differentiated on a basis of their chemistry. This has been demonstrated in the case of a Ni-superalloy which contained a range of precipitates.
The identification of different phases within alloys is important for the elucidation of the mechanisms by which precipitation occurs.

This information has been sourced, reviewed and adapted from materials provided by Oxford Instruments.
For more information on this source, please visit Oxford Instruments.