Raman spectroscopy is a spectroscopic method that is often utilized to observe low-frequency modes such as rotational and vibrational modes in a system. This technique depends on Raman scattering or inelastic scattering of monochromatic light, often from a laser in the visible, near ultraviolet, or near infrared range.
This article describes three Raman quantitative and semi-quantitative analysis applications in detail. These applications demonstrate the versatility of Raman spectroscopy in a wide range of industries.
When the laser light interacts with phonons, molecular vibrations, or other excitations in the system, the resulting energy of the laser photons is moved up or down. The shift in energy provides data regarding the vibrational modes in the system. Similar, but complementary data is produced by infrared spectroscopy.
In 1928, the inelastic scattering of light was observed in practice. The Raman Effect was discovered by means of sunlight, a narrow band photographic filter to produce monochromatic light, and a crossed filter to obstruct this monochromatic light. Systematic theory of the Raman Effect was later developed by Czechoslovak physicist George Placzek between the period of 1930 and 1934. The mercury arc became the main light source, initially with photographic detection and then with spectrophotometric detection.
With the advent of commercial IR spectrophotometers in the 1940s, the application of Raman spectroscopy reduced considerably. Later, the introduction of laser in the 1960s not only resulted in simplified Raman spectroscopy instruments, but also increased the sensitivity of this method.
Plastic Toys Safety
Phthalates are poisonous substances that are often added to PVC to soften the plastic. These substances are known to disrupt endocrine systems and are linked to reproductive defects. Despite their toxicity, some phthalate added-plastics have been found in toy manufacturing.
Phthalate esters are general types of plasticiser that are mixed in plastic products to make them more flexible. They are even added in a wide range of consumer products such as plastic wrapping, personal care products, lubricants, detergents and building materials. Certain phthalates have been declared as potential carcinogens, and traces of phthalates are present in every person. Since phthalates are not chemically bound to the plastics, they can be easily released by licking and through touch.
In spite of all this, there is no conclusive evidence to establish that phthalates are indeed toxic. Concerns regarding phthalates have resulted in a special legislation in a number of countries. In the EU, some low-molecular-weight phthalates have been banned from childcare articles and toys, while certain higher-molecular-weight phthalates are restricted to products which cannot be placed in the mouth.
In addition to exposure by direct dermal contact or ingestion, sweat may promote phthalate transfer from toys to the skin. To this end, scientists decided to explore the possibility of using artificial sweat and focused their attention on a specific phthalate called di(2-ethylhexyl) phthalate (DEHP), a popular plasticizer utilized in industry.
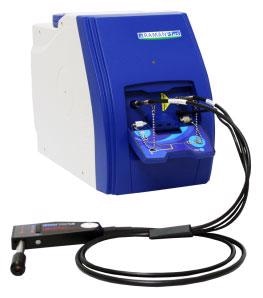
Figure 1. i-Raman® Plus Portable Raman spectrometer
In order to detect phthalates and their level of concentration in toys, B&W Tek’s i-Raman® Plus Portable Raman spectrometer with 785nm laser wavelength (Figure 1) was utilized to devise a quantitative analysis technique. The laboratory-grade performance of this system with respect to spectral resolution and sensitivity makes it suitable for this type of application.
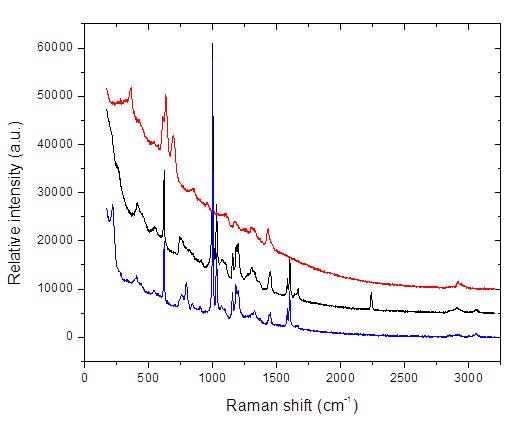
Figure 2. Raman spectral overlay of three different toys
Figure 2 depicts the Raman spectral overlay of three different toys obtained from three different manufacturers. In two of the Raman spectra, i. e, black and blue, the Raman peaks for phthalate at 1040cm-1 and 1729cm-1 can be seen, indicating the presence of phthalates in these toys. While in the third Raman spectrum (red), the phthalate Raman peaks are not obvious. This indicates that the toy denoted by the red spectrum has little to no phthalate.
Security
The substances often identified at crime scenes are mixtures, which could be either illicit drugs or explosive residuals. Rapid mixture analysis is very important during drug raids or at the crime scene.
Raman spectroscopy has wide applications in the defense and homeland security arenas. The Raman Effect can be leveraged to trace and identify chemicals in a wide range of environments and can even be used for detecting hazards at checkpoints, in the field, or in forensic laboratories without contacting the substance.
Fluorescence is a main source of error that overpowers the Raman signal. It is induced by the background and the sample matrix. New techniques are being developed to improve the sensitivity of Raman signal and reduce the effects of fluorescence by changing the way hazard materials interact with the incident laser and their environment.
Some of the basic Raman methods used in homeland security applications comprise surface-enhanced Raman spectroscopy (SERS), traditional (off-resonance) Raman spectroscopy, temporally and spatially offset Raman spectroscopy (TORS and SORS), and resonance Raman spectroscopy. Additional emerging Raman methods such as Heterodyne imaging, Raman imaging and remote Raman detection are also being developed to further improve the Raman signal, reduce fluorescence effects and monitor hazards for use in defense and homeland security applications.
Present generation of Raman technology and software development has advanced significantly, making it possible to incorporate handheld Raman analyzers with powerful mixture analysis capabilities. B&W Tek’s TacticID™ is an excellent example of such a device, where the robust mixture analysis capability is integrated into a handheld instrument. The TacticID is capable of identifying components in a mixture and can generate results in a matter of seconds.
PAT: Pharma Blending Process Monitoring
In the pharmaceutical industry, blending process control plays a key role in the decision of end tablet product quality. However, blending process control can be extremely complex when it comes to characterization or detection of the changes in raw materials and final blend homogeneity.
The combination of Raman spectroscopy and chemometric analysis can result in a novel method to measure the quantity of an API in blended powders and in the final tablet. In this study, quantitative testing of a blending process for tablets with 3mg of an API was performed with B&W TEK’s i-Raman® Plus portable Raman spectrometer with 785nm laser excitation.
Eleven powder samples with known API concentrations were utilized to produce the chemometric model. Using B&W TEK’s chemometric software BWIQ™, chemometric models were developed, with API weight per tablet set as the response. Following this, the Partial Least Squares Regression (PLS) was carried out on the spectral range of 800 to 3000cm-1. The PLS model showed good linear fit to the data with R2=0.9922 and standard error = 0.01384. Next, Raman spectra from two tablets were utilized to predict the quantity of API in the tablet. Table 1 shows the prediction result, which confirms that Raman spectroscopy with chemometric analysis is suitable for quantitative testing of APIs in tablets and blend mixtures.
Table 1. Prediction result
| Prediction Tablet |
Predicted API (mg/tablet) |
| T1-1 |
2.9668 |
| T1-2 |
2.9244 |
| T2-1 |
2.9038 |
| T2-2 |
2.9296 |
Conclusion
Raman spectroscopy is suitable for quantitative analysis of phthalates content in plastic toys, for rapid mixture analysis of suspected powders in law enforcement and forensic labs and for quantitative analysis of APIs in blend mixtures and tablets. Thus, Raman quantitative and semi-quantitative analysis applications demonstrate the flexibility of Raman spectroscopy and its potential impact in a wide range of industries.

This information has been sourced, reviewed and adapted from materials provided by B&W Tek.
For more information on this source, please visit B&W Tek.