White powder events became frequent across the United States following the September 11th terrorist attacks. Receipt of an unknown white powder in the post is described as a white powder event. These types of attack normally contain no toxic materials and are executed for the purpose of damaging infrastructure and causing terror.
Since these events, the US Postal Service and FBI have taken action against thousands of such attacks. This article discusses the forensic detection of commercially sourced white powders utilized in hoax powder attacks by means of morphologically directed Raman spectroscopy (MDRS) with the Morphologi G3-ID.
Artificial Sweeteners
The most commonly used commercially sourced white powders are artificial sweeteners, which are a mixture consisting of a sweetening agent and bulking material. The high sweetness of these sweetening agents requires the addition of a bulking agent or filler like dextrose. The brand of sweetener can be identified if the sweetening agent is detected.
Morphologically Directed Raman Spectroscopy
Raman spectroscopy is used in forensic science for molecular chemistry determination due to its advantages such as speed, reliability, non-destructive nature, and because it does not require contact with the sample. The technique is applied to identify whether the hoax powders are artificial sweeteners. The presence of high volume of bulking material suppresses the Raman signal of the sweetening agent in a conventional bulk analysis.
Besides having the advantages of bulk Raman spectroscopy, Raman microspectroscopy is capable of identifying and analyzing the different chemically distinct components of the white powder. Artificial sweeteners consisting of the same components can be differentiated using the particle size and morphology data.
The subjective element can be removed from the measurement of particle size and morphology in the case of automatic image analysis, thus providing a quicker process when compared to counting and measuring the single particles in a greater mixture. The unique combination of Raman microspectroscopy and automatic image analysis of the particles in MDRS allows the acquisition of physical and chemical data regarding the components of the mixture. The ability to differentiate and identify the brands of components in a mixture makes the MDRS a powerful instrument for the analysis of suspicious white powders.
Experimental Procedure
The Morphologi G3-ID instrument’s integrated Sample Dispersion Unit (SDU) was used for automated dispersion of two commercially available artificial sweetener blends, Sample A (saccharin / dextrose) and Sample B (sucralose / dextrose). The standards were used to create a spectral reference library with point spectra for each of the components under analysis (Figure 1). The sample analysis was then performed on the Morphologi G3-ID.
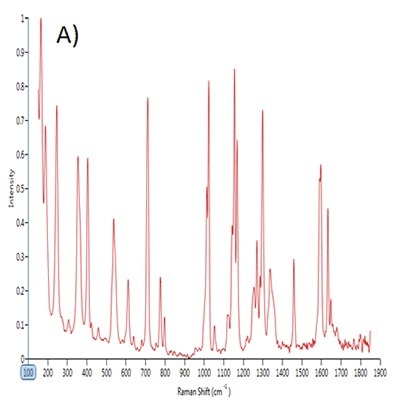
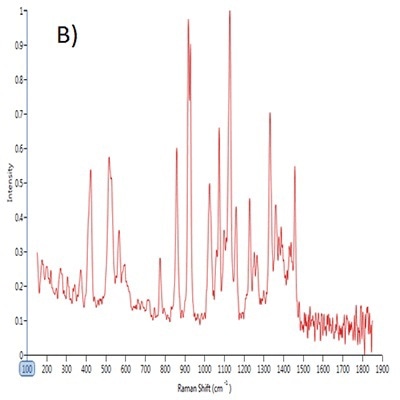
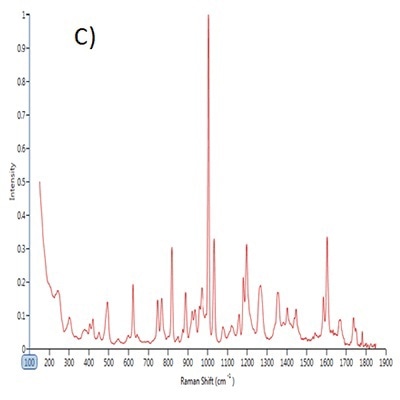
Figure 1. Point spectra of A) saccharin, B) dextrose and C) sucralose.
The 10x objective magnification was used to measure the morphological data and the 785 nm semiconductor laser was used to acquire the Raman spectra automatically from selected particles. The image analysis software tagged particles of > 7.0 µm circle equivalent diameter (CED) for chemical targeting.
Morphological data was acquired for roughly 150,000 particles in Sample A and 100,000 particles in Sample B. For Raman spectroscopy, around 3000 particles per sample were targeted over its spectral range of 150-1850 cm-1. The total time taken for morphological and chemical analysis was roughly 18 hours.
The comparison of the individual particle spectra with the reference spectral library was done to perform correlation calculations. A correlation value approaching ‘1’ represents good agreement with that reference, and a value approaching ‘0’ represents no match. These correlation values were used to chemically classify the particles and generate the particle size distributions (PSD) of the individual component populations.
Experimental Results
It was not possible to conclude the identification of the individual components in each sample by shape or size using the automated imaging data. Conversely, the Raman chemical identification enabled classification of individual components (Figures 2 and 3). The scatter plots depicted in Figures 2 and 3 show plotting of the correlation values of a particle to one component of the blend on the x-axis and the correlation value to the other component on the y-axis.
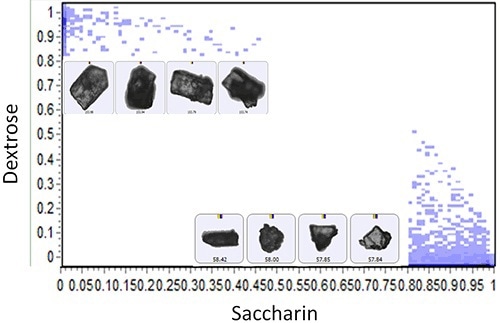
Figure 2. Scatter plot of the particle correlation values to saccharin versus dextrose for Sample A accompanied by example particle images.
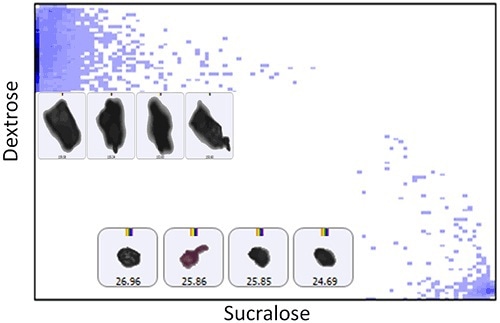
Figure 3. Scatter plot of the particle correlation value of sucralose versus dextrose for Sample B accompanied by example particle images.
Two discrete populations can be observed for each sample on these scatterplots when the correlation value was close to ‘1’ for each component. Few aggregated particles can also be observed with mid correlation values to each of the components. The next step was the generation and comparison of particle size distributions for each of the chemical classes determined.
The dextrose component showed a particle size distribution analogous to that of overall blend in the case of both samples (Figures 4 and 5). Conversely, the PSD of the active sweetener components is drastically different from that of their overall respective blends. In a conventional bulk Raman analysis, the larger volume of dextrose would mask smaller particles present in a lower volume. This can be overcome with the automated particle specificity provided by MDRS. Hence, it is possible to use the PSD of the individual sweetening component of an artificial sweetener blend to identify the specific brand of artificial sweetener employed in a hoax powder attack.
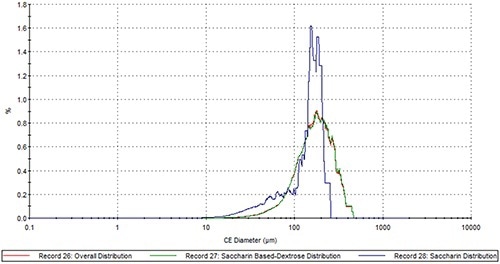
Figure 4. The comparison of the saccharin PSD (blue), the dextrose PSD (green) and the overall PSD (red) in Sample A.
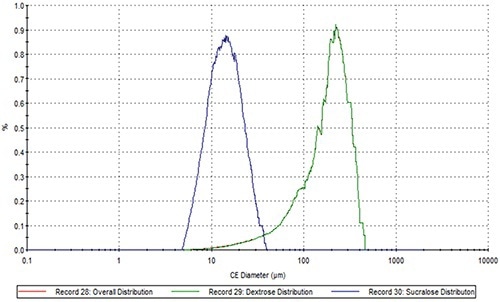
Figure 5. The comparison of the sucralose PSD (blue), the dextrose PSD (green) and the overall PSD (red) in Sample B.
The relative concentrations of the sweetening agent and the dextrose bulking material for the samples are depicted in Figure 6. The ability to determine the low volume contribution components in a bulk material and measure their morphological parameters is helpful for source attribution and contaminant analysis. Besides identifying the sweetener used in a hoax powder attack, these data are useful to predict the location of origination of the attack.
Conclusion
MDRS is a valuable tool in the characterization of suspicious powders employed in fake bioterrorism attacks. The combination of Raman microspectroscopy’s molecular identification power and automated image analysis allowed for component specific characterization.
A range of component particles of an artificial sweetener can be chemically identified and classified using the Morphologi G3-ID, making the instrument ideal for forensic analysis of hoax powder attacks. In addition, the Morphologi G3-ID is useful in source determination or exclusion. It is possible to apply the MDRS technique to identify counterfeit substances and determine contaminants in drug mixtures.

This information has been sourced, reviewed and adapted from materials provided by Malvern Panalytical.
For more information on this source, please visit Malvern Panalytical.