Materials can have varying polymorphic forms, meaning that the crystal structure can differ, even though the chemical composition is the same. Polymorphs occur in both organic and inorganic materials, including silica and metal oxides. Different polymorphs have different stabilities and may be formed because of the crystallization process. In pharmaceutical products, polymorphism plays a major role because the efficacy of a drug can be significantly affected based on the solubility of varied crystal forms.
Raman Spectroscopy
Raman spectroscopy is used to characterize materials by analyzing molecular or crystal rotations and vibrations that are excited by a laser, and exhibit vibrations that are specific to the molecules molecular bonds and crystal arrangement. Raman technology has excellent spectral specificity and serves as a useful tool in identifying different forms of polymorphs. In addition, it can be utilized for studying the solvate forms including the kinetics of polymorphic crystallization and transitions processes. Raman spectroscopy can also be utilized as a process analytical technology (PAT) tool for online and nonstop monitoring of polymorph transformations and chemical reactions.
Portable Raman instruments can be used to detect polymorphs, which display clear spectral variations due to a different molecular arrangement in the crystal. Raman technology proves useful in process development where the screening, formation, and stability of polymorphs are determined, thanks to its ease of use and compact scale. Figures 1 to 3 show the Raman spectra of a few polymorphs, revealing the clear and distinct Raman spectra for calcium carbonate (calcite and aragonite), citric acid, and dextrose, respectively.
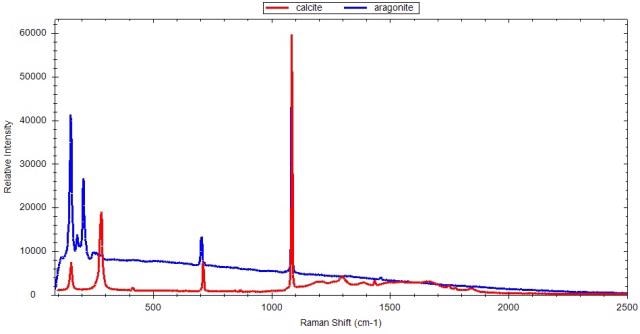
Figure 1. Raman spectra of two polymorphs of calcium carbonate: calcite and aragonite
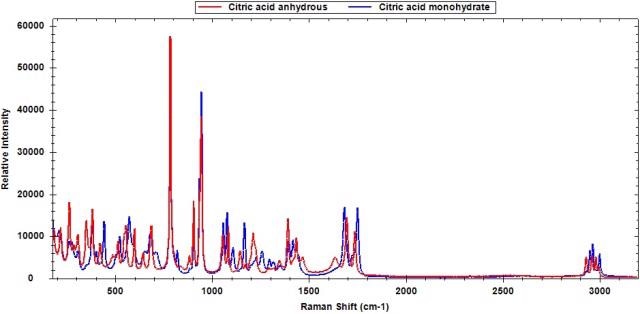
Figure 2. Raman spectra of citric acid polymorphs
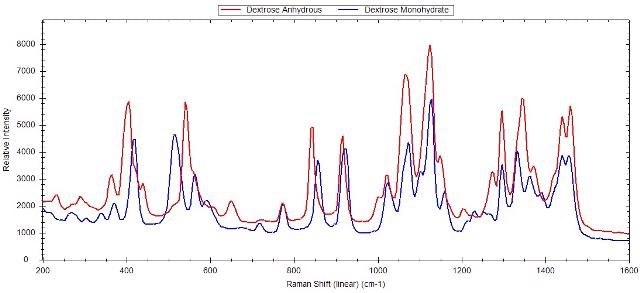
Figure 3. Raman spectra of anhydrous dextrose and dextrose monohydrate
Experimental Framework
In this experimentation, B&W Tek’s iRaman Plus is used to demonstrate how the portable Raman serves as an excellent process monitoring tool. Measurements were carried out by means of a portable I Raman Plus integrated with a patented CleanLaze® laser and a sensitive TE- cooled back-thinned CCD. The CleanLaze® laser is excited at 785nm with 300mW power output and covers a spectral range of 175 to 3200cm-1. Next, a long shaft Raman probe is placed over the surface of the sample, at a 5mm working distance in such a way that the laser is properly focused as a spot. Subsequently, data was obtained with 300mW laser power with an acquisition time of 15 to 30s.
In this analysis, citric acid is used as a model system to analyze polymorphism based on its solid crystal phases: anhydrous and monohydrate, which crystallize from water under varied temperatures. Sigma-Aldrich supplied the citric acid anhydrous and citric acid monohydrate.
The solid powder was heated from room temperature to 80°C to convert the monohydrate state into anhydrous state. Then, B&W Tek’s BWSP-21pt11 software was used for real-time tracking and trending of the citric acid transition. This enables constant data collection and trending depending on the chemometric models, evolving PCA scores, or data trends. Here, the focus is to track the conversion and not to determine the quantity of the forms in the system during the course of the process. Therefore, the formation of the anhydrous form with altered intensity of the new peak at 1146cm-1 and the trend of the monohydrate peak disappearance at 1108cm-1 were used. Other peaks are also there which are specific to the anhydrous form at 1635, 2932 and 2982cm-1 and the monohydrate form at 442, 820, 1167, 1260 and 2950cm-1. These peaks may be instantly utilized to trend the transition.
Figure 4 shows an overlay of spectra obtained on a constant basis as the temperature is raised to 80°C, while Figure 5 clearly shows the spectral changes on phase transition. Figure 6 illustrates the trend of the disappearance of the monohydrate peak produced in real-time during the course of data collection.
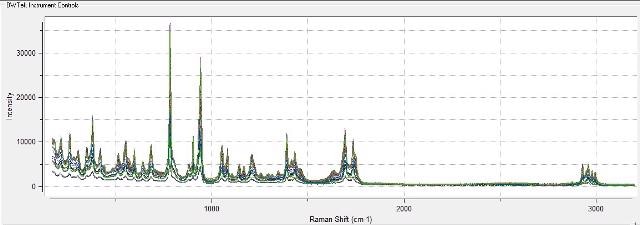
Figure 4. Overlay of Raman spectra collected every 15 seconds during temperature increase to induce monohydrate to anhydrous transition in citric acid.
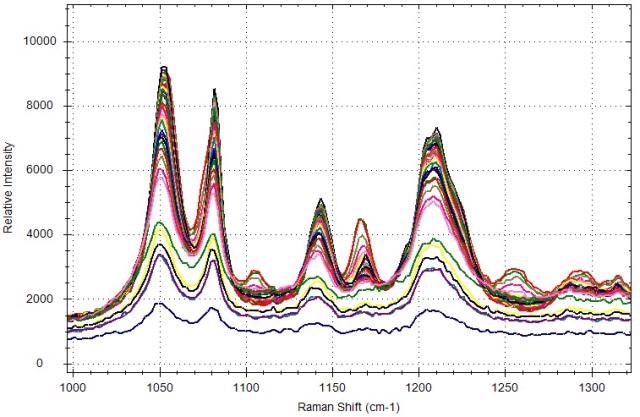
Figure 5. Expanded view of Raman spectra collected during citric acid phase transition.
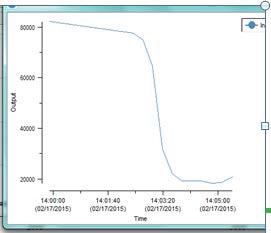
Figure 6. Trend of Raman peak area of 1108 cm1citric acid monohydrate, during temperature increase from room temperature to 80°C.
Conclusion
The spectral changes corresponding to the transition from the monohydrate form to the anhydrous citric acid are not restricted to distinct changes. As a result, principal component analysis or PCA can be used to capture the spectral changes with a rise in temperature. When the PCA analysis was used across the entire spectral range, it was observed that the initial component justifies 90% of the data difference during the time of the 75 spectra obtained. Additionally, a line plot of the score of PC -1 versus the sample spectrum reveals the same trend as observed by tracking a peak and shows the variations across the Raman spectrum with transition from the monohydrate to anhydrous form. The plot of the PC-1 scores is shown in Figure 7.
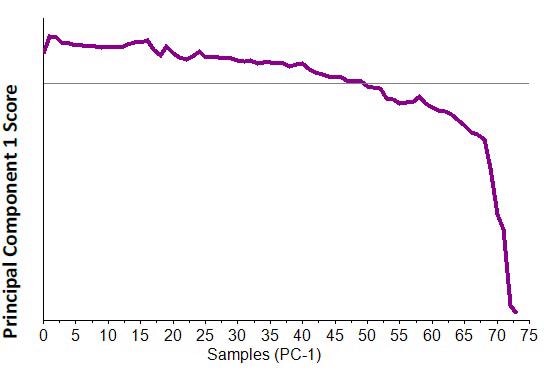
Figure 7. PC-1 score plot from full spectral range PCA analysis of 75 spectra collected during temperature experiment.
In this analysis, a few instances were used to demonstrate the capability of Raman spectroscopy to detect and monitor different forms of polymorphs. B&W Tek’s portable i–Raman Plus along with BWSP -21pt11 software was used for nonstop tracking and trending of citric acid transition from monohydrate to anhydrous form, and spectra is obtained every 15 seconds as the temperature was increased.

This information has been sourced, reviewed and adapted from materials provided by B&W Tek.
For more information on this source, please visit B&W Tek.