Multi-detection size exclusion chromatography (SEC) is a combination of column chromatography and light scattering, ultra violet (UV), viscometer and refractive index (RI) detectors, making it a robust analytical tool. It is simple to incorporate multi-detection SEC into the workflow of processes requiring the effective analysis of protein mixtures. The analysis of a semi-purified protein mixture comprising β-amylase is described in this article (Figure 1).
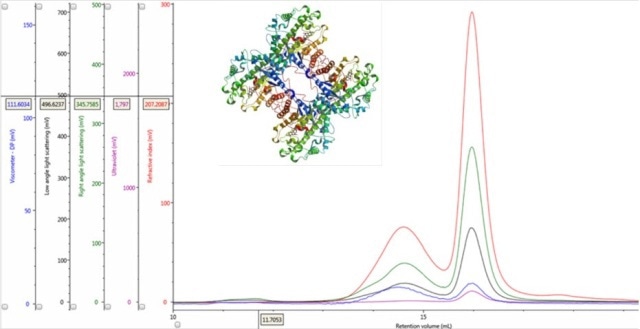
Figure 1. Multi-detector chromatograms of β-amylase from sweet potato (Main); Crystal structure of β-amylase from sweet potato (inset, PDB ID:1fa2).
Materials and Methods
A solution of a semi-purified mixture consisting of β-amylase from sweet potato was prepared in phosphate buffered saline (pH 7.4), with a concentration of roughly 2mg/mL. The resulting solution was then filtered using a 0.2 µm cellulose acetate membrane. Analytical size exclusion columns (2 x Viscotek P3000, Malvern Panalytical, UK) were used for chromatographic separation of protein mixtures.
The mobile phase was the phosphate buffered saline. Data acquisition was performed by maintaining samples, columns and detectors at 25 °C. The zero waste injection mode was used to apply aliquots of 100 µL onto the columns. A complete OMNISEC system featuring the OMNISEC REVEAL detector module and OMNISEC RESOLVE separations module was used to perform all of the measurements.
Results and Discussion
Interpretation of Deconstructed Multi-Detection Data
Multi-detection SEC provides meaningful data. Each detector shows response to the specific properties of the eluting protein molecules and these responses are collectively considered as a characteristic fingerprint for each protein being analyzed.
RI Detection
An RI detector is used in conventional chromatography to monitor the elution of the sample components through the column. The RI elution profile of the β-amylase mixture is presented in Panel A in Figure 2. It is possible to clearly discern two main peaks with respective retention volumes (VR) of 14.60 mL (Peak 1) and 15.97 mL (Peak 2). The molecules eluting first have larger hydrodynamic size. By applying size exclusion principles, it can be concluded that two species have different hydrodynamic properties.
Combination of RI and Light Scattering Signals
The combination of a concentration detector and static light scattering detectors can determine molecular weight using the Rayleigh equation. However, the apparent molecular weight of two different peaks can be compared by applying a more simple calculation to raw chromatograms. From the simplified Rayleigh equation, it can be concluded that the apparent molecular weight of molecules in a peak varies in proportion to the ratio of light scattering signal to the concentration (LS/C).
The application of this input to the signals in multi-detection chromatograms allows the conclusion that if the LS/C ratio of the two proteinaceous peaks is same, then their apparent molecular weight must be the same. An overlay of RI and light scattering signals is shown in Panel B in Figure 2. Interestingly, RALS/C and LALS/C ratios are the same for the two peaks.
Combination of RI Detection and Viscometry
Two conditions could describe how this sample could generate chromatograms with peaks of the identical molecular weight but temporally distinct VR. The first condition is that the sample is composed of two structurally different species of β-amylase which have different hydrodynamic sizes. The second condition is that the sample may consist of two different proteins of different hydrodynamic sizes, but with the same molecular weight.
The ratio of Viscometer Differential Pressure (DP) and concentration responses (VDP/C) is evaluated to corroborate the validation of these assumptions by the data, thereby confirming that these assumptions are not just artefacts of run conditions or column degradation. An approximate intrinsic viscosity value (IV) can be derived by taking the VDP/C ratio from the apex of the peaks shown in Panel C in Figure 2 below. Since more open structures have higher IVs, it is possible to rationalize earlier elution for Peak 1 with a larger hydrodynamic size.
Insight from the Concentration Detectors
The data obtained from the concentration detectors can be helpful in understanding which of the aforementioned possibilities best represent the β-amylase sample. The RI detector generates signals in response to the refractive index variations between the mobile phase and the eluting protein molecule, whereas the UV detector generates signals in response to the presence of UV absorbing chromophores at a specific wavelength.
In both cases, the magnitude of these signals varies in proportion to the protein concentration. However, it is possible to determine the absolute concentration at a particular point or under a peak if the relevant coefficients - dn/dc and dA/dc - for the protein being studied are already known. Protein measurements typically involve the use of a dn/dc value of 0.185 mL/g. This means that concentration for most proteins can be directly determined using RI. However, the dA/dc is protein dependent in the case of UV, depending on the type and number of chromophores present in each protein molecule.
If the two protein molecules are identical in terms of composition, but differ in hydrodynamic size, the ratio between the RI and UV signals (RI/UV) would be the same for both proteins as the dn/dc and dA/dc ratios are equal. However, the β-amylase mixture showed different RI/UV ratios for Peaks 1 and 2 (Figure 2, Panel D). Since dn/dc is relatively constant for these proteins, dA/dc greatly contributes to the difference in the RI/UV ratios, revealing that peak 1 is an entirely different protein instead of an aggregate of the β-amylase.
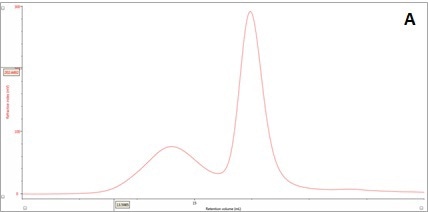
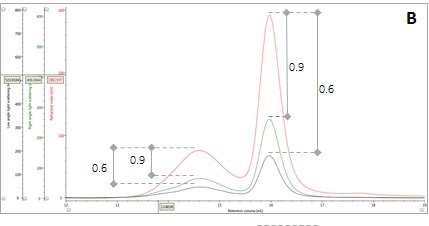
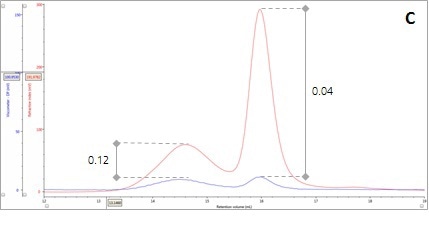
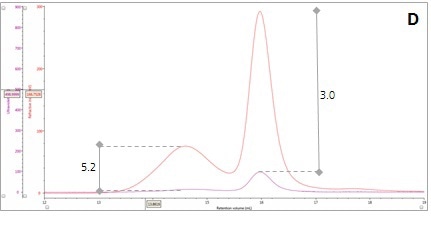
Figure 2. Multi-detector chromatograms: (A) RI response (red), (B) Overlay of RI (red) and light scattering responses (green and black), (C) Overlay of RI (red) and Viscometer responses (blue), (D) Overlay of RI (red) and UV (purple) responses. The peaks in Panels B-D have been annotated with the ratios of RALS to RI, LALS to RI, Viscometer to RI and RI to UV, respectively.
Figure 3 and Table 1 present the results of processing the multi-detection data. The two peaks have very similar molecular weights, but different hydrodynamic radius. The RI detector revealed that roughly 30% of the sample mixture is Peak 1 and 70% of the mixture is Peak 2. With the molar extinction coefficient for sweet potato β-amylase, the UV detector helps to identify peak 2 as the β-amylase. This means that the contaminating protein is Peak 1.
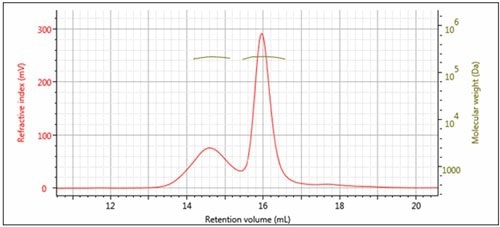
Figure 3. Overlay of multi-detector chromatograms with Mw.
Table 1. Summary of quantitative results obtained from data processing.
| Parameter |
Inj. 1 Beta amylase |
| Peak 1 |
Peak 2 |
| RV (mL) |
14.60 |
15.97 |
| Mw (g/mol) |
209,200 |
214,200 |
| Pd () |
1.001 |
1.001 |
| IVw (dL/g) |
0.1572 |
0.05705 |
| RHw (nm) |
8.034 |
5.771 |
| Frac. of sample (%) |
28.61 |
71.39 |
Conclusion
This article discussed the analysis of multi-detection data to gain insights into the composition of a semi-pure extract of β-amylase. The multi-detection data provides more meaningful data than that which could be obtained from a single detector, which would have revealed that the sample is a mixture of the primary protein and some aggregated material.
Conversely, the multi-detection data revealed that the secondary peak was not an aggregate, but actually an entirely different contaminating protein. Although the molecular weight of the contaminating protein was the same as the β-amylase, its UV response revealed that it would be a different molecule. The viscometer data suggested that the two proteins have different structures, causing a difference in elution volume despite the similar molecular weight.
Although the identity of this contaminating protein remains unrevealed, the multi-detector SEC data has helped to draw the conclusion that the sample is a mixture of two different proteins with a very similar molecular weight. It is not possible make this conclusion with any one detector alone. The use of advanced, multi-detector SEC systems such as OMNISEC in the protein field allows researchers to gain new insights into the composition of their protein samples and discern aggregates from other contaminants, thereby enabling the performance of comprehensive characterization of such purified proteins and the understanding of their behavior when they are used as biopharmaceutical drugs or in assays.

This information has been sourced, reviewed and adapted from materials provided by Malvern Panalytical.
For more information on this source, please visit Malvern Panalytical.