Acetylacetone (2,4-pentanedione) is a β-diketone that occurs in the form of enol and tautomeric keto mixture. In basic solution, this organic compound is deprotonated to form the acac or acetylacetonate anion, as shown in Figure 1.
Metal acac compounds are separated as neutral crystalline solids, and therefore, a Mn+ metal produces a complex with n acac ligands, as illustrated in Figure 2.
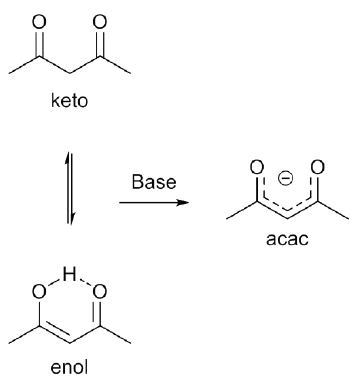
Figure 1. Keto-enol equilibrium of acetylacetone and formation of acetylacetonate anion.
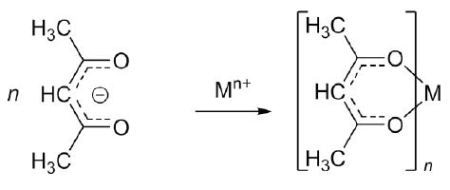
Figure 2. Acetylacetonate forms neutral complexes with most metals.
The article provides a suitable platform for students to produce a complex of metal acetylacetonate, interpret the keto-enol tautomerization of acetylacetone, and ultimately quantify the compound’s electronic structure by means of the Evans method and the Spinsolve NMR spectrometer.
A Paramagnetic protocol is integrated in the Spinsolve NMR spectrometer that makes it possible to measure paramagnetic compounds at a higher concentration when compared to the traditional 1D proton protocol. Spectra of transition metal acac compounds that are initially acquired by students will show whether the complex is indeed diamagnetic or paramagnetic;
The acetylacetone’s 1H-NMR spectrum is also determined since both tautomers are present in solution on the NMR time scale. By comparing the 1H-NMR spectrum of acetylacetone with the 1H-NMR spectrum of a diamagnetic acac complex, students can assign the peaks for individual tautomer, and thus, establish the keto:enol ratio.
Experimental Procedure
A paramagnetic and a diamagnetic metal acetylacetonate complex will be initially produced and a 1H-NMR spectrum will be obtained through the Paramagnetic protocol. Using Evans method, the number of unpaired electrons and the electronic structure of paramagnetic complexes are determined.
The students can assign the resonances in the 1H-NMR spectrum of the diamagnetic complex and also acquire a 1H-NMR spectrum of acetylacetone. The keto:enol ratio is then determined by comparing the spectrum against the diamagnetic acetylacetonate complex.
Al3+ Complex
A conical flask is taken in which 40mL distilled water and 3mL of acetylacetone are added. This is followed by adding 8mL of dilute (5 mol L-1) ammonia solution. Aluminum sulfate [Al (SO4)3 •16 H2O] is then dissolved in 30mL of distilled water, and ammoniacal acetylacetone solution is slowly added to this solution with constant stirring. Once acetylacetone is fully added, the solution is checked whether it is neutral or not. In case the solution turns out to be still acidic, small quantities of ammonia solution are added. Next, the flask is placed in an ice bath until it a cream colored precipitate is produced.
The product thus obtained is filtered through Buchner filtration and the same is cleaned with cold distilled water and dried in a vacuum desiccator. The percentage yield of this dry product is then subsequently measured. A sample of warm petroleum ether is recrystallized, and the needles thus obtained are filtered through Buchner filtration, washed with cold petroleum ether, and finally died in a vacuum desiccator. Using the Paramagnetic protocol on the Spinsolve NMR spectrometer, a 1H-NMR spectrum of the product in chloroform-d is acquired.
As seen in Figure 3, the 1H-NMR spectrum of Al (acac)3 exhibits sharp resonances in the region from 0 to 8ppm, which is often the case for majority of molecules. Based on these resonances, it can be considered that the complex is diamagnetic as predicted, because Al3+ has the electron configuration of neon and hence does not have unpaired electrons.
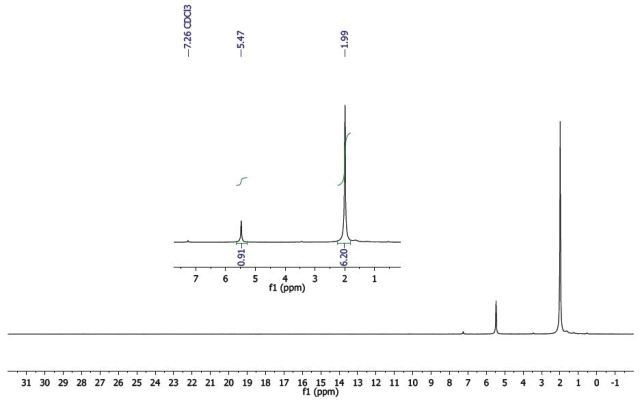
Figure 3. 1H-NMR spectrum of Al(acac)3 .
Since the integrals of the two resonances (inset, Figure 3) display a 1:6 relationship, the peak at δ 5.47 integrating for a single proton matches with the CH, whereas the peak at δ 1.99 integrating for 6 protons matches with the two methyl groups, as indicated in Figure 2.
Co3+ Complex
A conical flask is taken in which 20 mL of acetylacetone and 2.5 g of cobalt carbonate are added and the mixture is heated to 90°C with constant stirring. During the heating process, 30mL of a 10% hydrogen peroxide solution is added and a watch glass is used to cover the flask in between the additions. This mixture is further heated for a period of 15 minutes and then cooled in an ice bath.
Using Buchner filtration, the dark green precipitate is filtered, sucked dry at the water pump, and dried in the oven at 100°C. The percentage yield of the dry product is then determined.
A small sample of hot petroleum ether is recrystallized, and the resulting green needles are filtered utilizing Buchner filtration, washed with cold petroleum ether, and then dried in a vacuum desiccator. Using the Paramagnetic protocol on the Spinsolve NMR spectrometer, a1H-NMR spectrum of the product in chloroform-d is acquired.
In Figure 4, the 1H-NMR spectrum of Co(acac)3 exhibits sharp resonances similar to the aluminum complex. Based on these resonances, it can be assumed that the complex is diamagnetic.
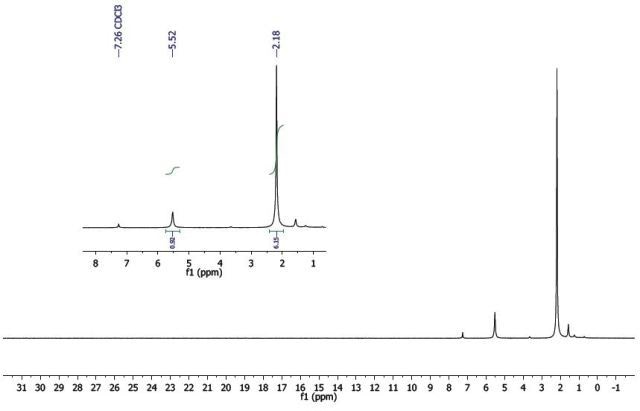
Figure 4. 1H-NMR spectrum of Co(acac)3.
High spin or low spin are two potential electron configurations seen in octahedral Co(III) centers (Figure 5). Four unpaired electrons exist in the high spin complex, which makes it paramagnetic, while no unpaired electrons exist in the low spin complex, which is diamagnetic, and hence, a low spin configuration is adopted by the cobalt complex.
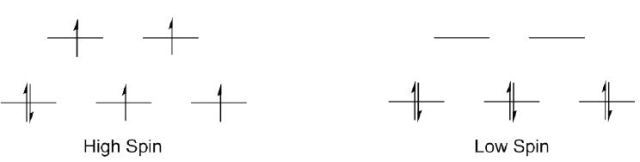
Figure 5. Two possible electronic structures of Co(III).
Since the integrals of both resonances (inset, Figure 4) display a 1:6 relationship, the peak at δ 5.52 integrating for a single proton is relative to the CH, while the peak at δ 2.18 integrating for 6 protons is relative to the two methyl groups (Figure 2).
Mn3+ Complex
In 100mL of distilled water, 6.8 g of sodium acetate and 2.6 g of manganese chloride (MnCl2 •4 H2O) are dissolved followed by 10 mL of acetylacetone. Next, 0.52 g of potassium permanganate (KMnO4) is dissolved in 25 mL of distilled water followed by acetylacetonate solution, with continuous stirring for 10 minutes.
A solution of sodium acetate (6.3g) is then added in 2 5mL distilled water and stirred for 10 minutes. The flask is heated on a hot plate for 60-70°C for 15 minutes, cooled to room temperature, and placed in an ice bath.
Through Buchner filtration, the dark precipitate is filtered, rinsed with cold distilled water, and dried in a vacuum desiccator. The percentage yield of this dry product is ultimately determined.
A small sample of warm petroleum ether is recrystallized, and the black needles thus obtained are filtered by means of Buchner filtration, washed with cold petroleum ether, and dried in a vacuum desiccator. Using the Paramagnetic protocol on the Spinsolve NMR spectrometer, a 1H-NMR spectrum of the product in chloroform-d is acquired.
As shown in Figure 6, the 1H-NMR spectrum of Mn(acac)3 includes broad and downfield resonances, indicating that the complex is paramagnetic. Two potential electron configurations, high spin or low spin are seen in octahedral Mn(III) centers (Figure 7). Mn(III) is d4, given that both configurations exhibit unpaired electrons and hence would be paramagnetic. The magnetic moment and thus the electronic structure of Mn(acac)3 are measured using Evans method.
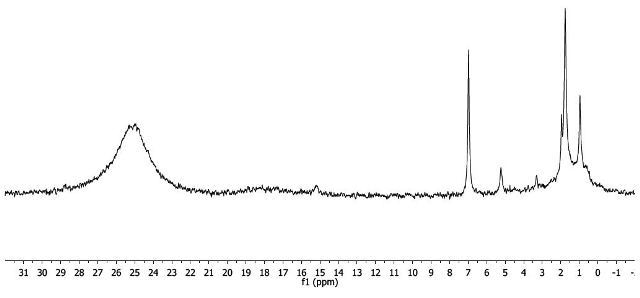
Figure 6. 1H-NMR spectrum of Mn(acac)3.
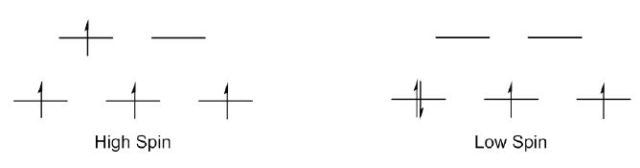
Figure 7. Two possible electronic structures for Mn(III).
In an NMR tube, about 5 mg of complex is taken, and 0.5 mL of solvent prepared with 10% t-butanol in CDCl3 is added. A reference sample comprising 0.5mL of the 10% t-butanol in CDCl3 solution is prepared. The Spinsolve NMR spectrometer is shimmed using Quick Shim and reference sample is determined using Quick Scan in the 1D Proton protocol.
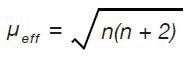
Five unpaired electrons exist in the high spin complex and one unpaired electron exists in the low spin complex. Equation 1 is used to determine the predicted effective magnetic moment for individual electronic structure:
High spin, n = 4; µeff = 4.90 µB
Low spin, n = 2; µeff = 2.83 µB
It was found that the magnetic moment of the high spin complex is relatively closer to the empirical value, and hence, it can be established that it is a high spin complex.
Fe3+ Complex
In 25mL of distilled water, 3.3g of iron(II) chloride (FeCl2 •66 H2O) is dissolved. About 4mL of acetylacetone in 10mL of methanol is added with continuous stirring for 15 minutes. This results in a red mixture to which 5.1g of sodium acetate solution dissolved in 15mL distilled water is added, which forms a red precipitate.
The solution is heated to 80°C over a period of 15 minutes, cooled and placed in an ice bath. Using Buchner filtration, the product is filtered, rinsed with cold distilled water, and dried in a vacuum desiccator. The percentage yield of the dry product is determined.
A small amount of warm methanol is recrystallized and the red crystals thus obtained are filtered using Buchner filtration, washed with cold methanol, and dried in a vacuum desiccator. Using the Paramagnetic protocol on the Spinsolve NMR spectrometer, a 1H-NMR spectrum of the product in chloroform-d is acquired.
As shown in Figure 8, the 1H-NMR spectrum of Fe(acac)3 includes wide and downfield resonances, similar to the manganese complex. This indicates that the complex is paramagnetic. Two probable electron configurations, low spin or high spin, exist in octahedral Fe(III) centres, as shown in Figure 9. Fe(III) is d5 as unpaired electrons exist in both configurations, and hence, the complex is paramagnetic.
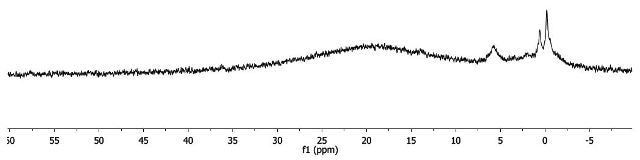
Figure 8. 1H-NMR spectrum of Fe(acac)3
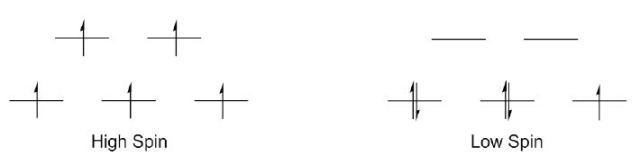
Figure 9. Two possible electronic structures of Fe(III).
The magnetic moment and thus the electronic structure of Fe(acac)3 are measured using the Evans method. Five unpaired electrons exist in the high spin complex and one unpaired electron in the low spin complex. The predicted effective magnetic moment for individual electronic structure is determined using the same Equation 1 as described above.
High spin, n = 5; µeff = 5.92 µB
Low spin, n = 1; µeff = 1.73 µB
It was observed that the magnetic moment of the high spin complex is considerably closer to the empirical value, and hence, it can be determined that it is a high spin complex.
Cu2+ Complex
A conical flask is taken in which 4g of copper(II) chloride (CuCl2 •6 H2O) is dissolved in 25 mL of distilled water. About 5 mL of acetylacetone in 10 mL of methanol is added to this solution with continuous stirring for 10 minutes. To the following mixture, 6.8 g of sodium acetate mixed in 15 mL of water is added, and the solution is heated to 80°C over a period of 15 minutes and cooled in an ice bath. The resulting blue-grey precipitate is filtered using Buchner filtration, rinsed with cold distilled water, and dried in the oven at a temperature of 100°C. The percentage yield of the dry product is then determined.
A small methanol sample is recrystallized, and the blue-grey needles are filtered using Buchner filtration, washed with cold methanol, and dried in a vacuum desiccator. With the help of the Paramagnetic protocol integrated on the Spinsolve NMR spectrometer, a 1H- NMR spectrum of the product in chloroform-d is acquired.
The 1H-NMR spectrum of Cu(acac)2 includes broad resonances, similar to the iron and manganese complexes. This indicates that the complex is indeed paramagnetic. Since Cu(II) has one unpaired electron, it is d9.
The same equation 1 is again used to determine the expected effective magnetic moment for Cu(II). n = 1; µeff = 1.73 µB
The predicted magnetic moment is in good agreement with the value which was experimentally determined.
(VO)2+ Complex
About 5 mL of distilled water is taken in a round-bottom flask and to this, concentrated H2SO4 is gradually added. This is followed by adding 12 mL of ethanol and 2.5 g of vanadium pentoxide (V2O5). A condenser is fitted to the round bottom flask and refluxed over a period of 90 minutes. This results in a dark blue-green solution, which is cooled and filtered through cotton wool and the remaining product is discarded.
Next, 6 mL of acetylacetone is added with continuous stirring. This solution was neutralized by adding it to a conical flask comprising 20 g of anhydrous sodium carbonate mixed in 150 mL of distilled water. The resulting mixture is cooled in an ice bath, and using Buchner filtration, the precipitate is filtered out. The product is rinsed with cold distilled water and dried in a vacuum desiccator. The percentage yield of this dry product is then determined.
A small quantity of the product was dissolved in 6 mL of dichloromethane and the remaining product was discarded. Next, 20 mL of petroleum ether was added and the mixture was swirled and allowed to stand over a period of 10 minutes. The product was filtered using Buchner filtration, washed with cold petroleum ether, and dried in a vacuum desiccator. The blue complex thus obtained is a d1 paramagnetic compound.
Cr3+ Complex
A conical flask is taken to which 1.4g of chromium(III) chloride (CrCl3 •6 H2O) dissolved in 50mL of distilled water is added. 10 g of urea is added in 3 or 4 parts with constant stirring, followed by adding 3 mL of acetylacetone. The flask is covered with a watch glass and heated to a temperature of 80 to 90°C.
The solution should be dark at first but as the reaction continues it forms maroon crystals. Following 90 minutes of heating, the mixture is cooled, and through Buchner filtration, the precipitate is filtered out. The product, however, is not washed but instead dried in air, and the percent yield is subsequently noted down.
A small sample of boiling petroleum ether is dissolved, decanted and reduced by half. It is then cooled in an ice bath and the crystals are filtered using Buchner filtration and dried at the water pump. The purple complex thus obtained is a d3 paramagnetic compound.
Acetylacetone Tautomerization
Five drops of acetylacetone are placed in an NMR tube and 0.5 mL of CDCl3 is added. A 1H-NMR spectrum of the sample is acquired using Quick Scan in the standard 1D Proton protocol. The 1H-NMR spectrum of acetylacetone includes 4 resonances, δ 5.37, δ 3.46, δ 2.07 and δ 1.88 ((Figure 10).
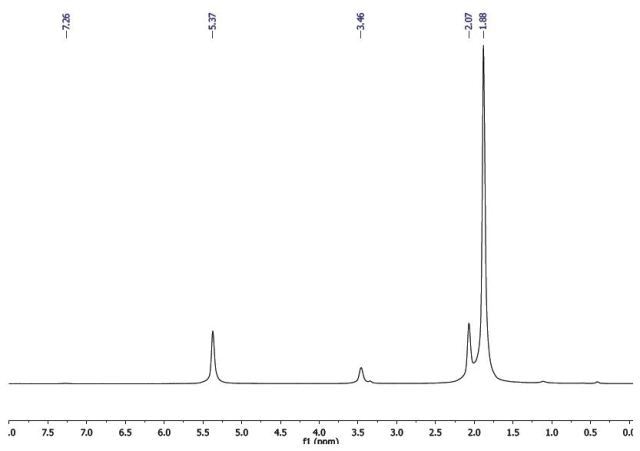
Figure 10. 1H-NMR spectrum of acetylacetone.
This is clear that the solution contains both keto and enol tautomers. Given that the enol form of acetylacetone can be considered as a complex of H+, the spectrum is compared against Co(acac)3 or Al (acac)3. While the chemical shifts of the methyl groups in the 1H-NMR spectrum of acetylacetone are found to be similar, the remaining resonances are quite different. This means, the resonance at δ 5.37 is the CH proton of the enol tautomer, and similar to the metal complexes, this tautomer exhibits a 1:6 peak relationship, i.e., two equivalent methyl groups and one CH group.
As a result, the resonances δ 5.37 and δ 1.88 are relative to the enol tautomer, thereby leaving the resonances δ 2.07 and δ 3.46 as the keto tautomer. The backbone carbon in this tautomer exhibits two protons and hence the ratio between the two peaks is 1:3. It is possible to determine the keto:enol ratio, with the resonances in the spectrum assigned to individual each tautomer. The CH and CH2 of the enol tautomer and the keto tautomer, respectively, are perfectly isolated, and their integrals can be utilized to measure the ratio.

This information has been sourced, reviewed and adapted from materials provided by Magritek.
For more information on this source, please visit Magritek.