The mechanism of polymer conductivity is directly associated with organic molecular structure changes caused by induced delocalization of electrons. Raman spectroscopy, in addition to traditional electrochemical experiments, has shown to be an effective tool for process characterization of conductive polymers.
In addition, the combination of Raman spectroscopy and electrochemical methods enables in-situ characterization of changes in the organic molecular structure during the time of electrochemical reactions.
Organic electronic cells like organic light emitting devices (OLEDs) provide a novel material platform to construct electronic devices that are both flexible and transparent. A major aspect in this realm of research has been dedicated to enhance the OLEDs’ material structure by improving the device efficiency, electrical conductivity, and light-emitting stability over a period of time.
Poly (3,4-ethylenedioxythiophene)-poly (styrenesulfonate), also known as PEDOT:PSS, is a potential conductive polymer for OLEDs. This polymer is extensively employed as a charge hole injector in organic optoelectronic devices due to its high chemical stability and high conductivity.
Previously, confocal microscopic Raman spectroscopy was used to conduct most Raman experiments with conductive polymers. The analysis showed comprehensive data regarding molecular structure changes at various potentials.
This article describes a chronoamperometric Raman study on PEDOT:PSS in an OLED structure using a handheld Raman spectrometer. Developed by Gamry Instruments, the application uses B&W Tek’s i-Raman spectrometer.
Experiment
An illustration of the setup for an electrochemical Raman measurement is shown in Figure 1. The setup includes a Raman spectrometer, a computer, a potentiostat, and a measurement cell.
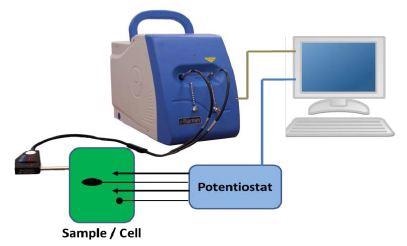
Figure 1. Illustration of the experimental setup for electrochemical Raman experiments.
B&W Tek’s i-Raman spectrometer features two different options for excitation laser wavelength - 532 nm or 785 nm. The suitable laser wavelength should be selected depending on the materials to be characterized. In this experiment, a 532 nm laser was employed for PEDOT:PSS, while the Raman spectrometer was linked to a PC through USB.
The sample of interest (PEDOT:PSS) was applied as a thin layer of film on the surface of a metal, which acts as a working electrode. Sodium sulfate in the form of aqueous solution was employed as an electrolyte.
This was nitrogen-purged prior to measuring. An Ag/AgCl electrode and a graphite rod were used as a reference electrode and counter electrode, respectively. All electrodes were subsequently linked to a Gamry’s potentiostat, which was joined to the PC through the USB.
The Framework software from Gamry Instruments makes it possible to adjust different parameters for both the Raman spectrometer and the potentiostat. Figure 2 shows the user interface for the chronoamperometric experiment.
Once the experiment was initiated, both the Raman and electrochemical experiments were concurrently run together.
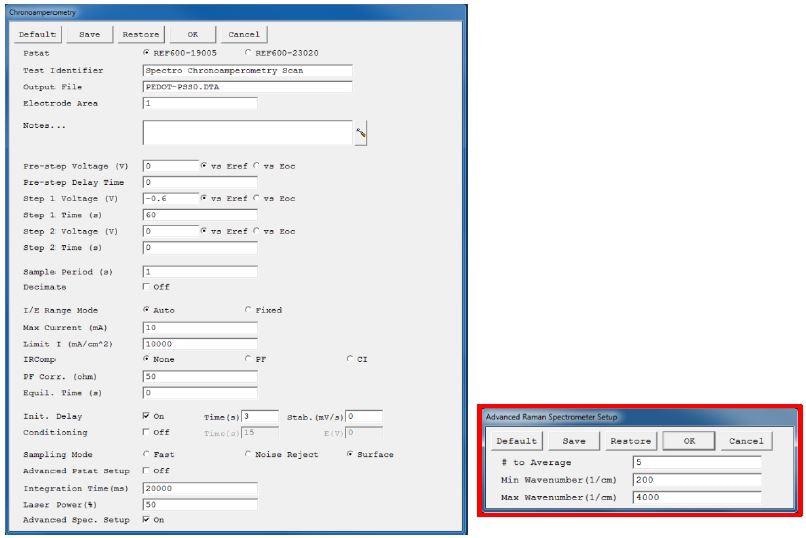
Figure 2. User interface for a chronoamperometric Raman experiment. The advanced spectrometer setup is highlighted in red.
Adjustments of various parameters of the chronoamperometric experiment were enabled by the first part of the user interface, which is parallel to all Gamry’s standard electrochemical experiments. Three extra lines at the end contain the parameters for modifying the Raman measurement.
The integration time (in milliseconds) shows the duration of a single Raman spectrum obtained, but higher Raman intensity can also be realized with longer integration times. Conversely, the electrode is also under longer exposure to the laser which can modify it on account of heat generation.
In addition, if longer integration times are used, the detector can be easily saturated. The laser power is provided as a percentage of the full power. Increased power level translates into increased signal intensity, and again the sample can be changed or destroyed by higher laser power.
In order to acquire an optimal signal-to-noise ratio without destroying or altering the sample, the right level of integration time and laser intensity should be applied.
On checking the “Advanced Spectrometer Setup”, an extra window emerges after pressing the “OK” button (Figure 2). Through this setup, users can easily modify the extra Raman settings.
The first line known as “# to Average” introduces an averaging function, and based on several spectra the final Raman spectrum will be averaged. This enhances the measurement’s signal-to-noise ratio, but still results in longer exposure times to the laser. “Max Wavenumber” and “Min Wavenumber” are the other two parameters that characterize the spectral range of the Raman Shift (cm-1) display during the course of the experiment.
The entire spectrum between 176 and 4000 cm-1 is saved in the final measurement file, irrespective of the set range.
Test Results and Discussions
Figure 3 displays a sequence of Raman spectra at various potentials during multiple chronoamperometric experiments with PEDOT:PSS.
After setting the integration time to 20 seconds, five spectra were averaged. This resulted in a 100-second exposure time for each saved spectrum. Subsequently, the laser power was set to 50%.
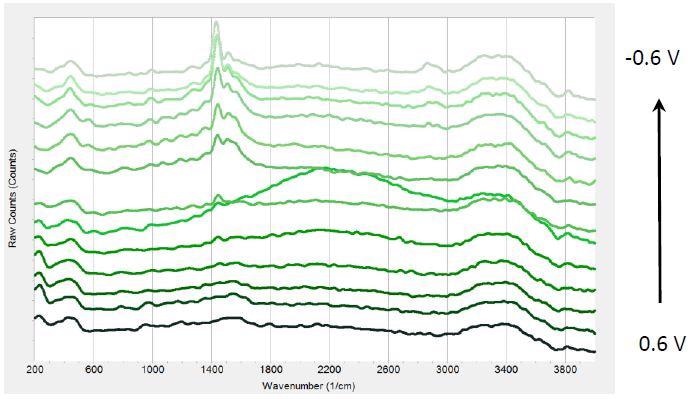
Figure 3. Raman spectra at different potentials from 0.6 V to -0.6 V from bottom to top in 0.1V steps.
To run the chronoamperometric experiment, an Interface 1000 potentiostat was employed. The polymer was decreased in a number of steps from +0.6 to -0.6 V.
When the potential was reduced, a peak at 1447 cm-1 emerges that becomes more prominent at negative potentials. Further, the peak shifts by -17 cm-1 from 0 to -0.6 V. Three weaker bands emerge at approximately 2870 cm-1, 1570 cm-1, and 1520 cm-1.
According to literature, the intense peak at 1447 cm-1 can be allotted to ring C-C stretching vibrations from PEDOT. The negative shift is attributed to increased conjugation length of oxidized parts to their neutral state during the time of reduction. PEDOT reduction can result in long-term stability and reduced efficiency of LEDs.
During LED operation, electrons are allowed to withdraw from PEDOT to form electron holes in the polymer layer. However, electrons are introduced into the electron transporting layer close to the cathode.
Recombination between electron holes and electrons subsequently leads to radiation emission, but recombination does not occur often. Electrons can easily shift to the PEDOT-PSS layer and reduce PEDOT.
Conclusion
Raman spectroscopy, in combination with conventional electrochemical methods, can be concurrently used to define electrochemical reactions. This combined technology enables complete characterization of different reaction mechanisms.
Through B&W Tek’s i-Raman spectrometer and Gamry’s potentiostat, PEDOT:PSS’ structural changes during its electrochemical reduction were effectively examined using chronoamperometric Raman experiments. The results obtained provide valuable data to enhance the efficiency and lifespan of OLEDs.

This information has been sourced, reviewed and adapted from materials provided by B&W Tek.
For more information on this source, please visit B&W Tek.