A very serious issue in turbine and other industrial oils is water contamination, and water testing forms a part of any lubricant condition monitoring program. Turbine oils normally are formulated to have oxidation resistance, high thermal stability, and exceptional water separation.
Lubricants that are commercially available specifically for steam turbines or gas turbines, are fabricated with specific additive formulations, but there are also numerous oils that can function with different types of turbines. Gas turbines tend to build up sludge and varnish while steam turbines may experience foaming, oxidation, and sludge. However, water contamination in turbine systems is a concern. Severe water contamination can result in changes in the oil’s viscosity, additive depletion, accelerated oxidation, and reduced bearing life. Turbine manufacturers commonly advise a warning alarm limit of <1000 ppm.
The most extensively accepted technique for detecting water in oil is by Karl Fischer (KF) coulometric titration (ASTM D6304)1. This titration technique is rather cumbersome, as it requires dangerous reagents, meticulous sample preparation, expensive equipment and at least a number of minutes per analysis. However, Karl Fischer analysis for water can yield repeatable and highly accurate results when performed by a skilled operator and is the comparative technique for other analytical techniques for water determination. Furthermore, the water need not be fully dissolved in the oil.
The FluidScan handheld, infrared analyzer can spot the light scattering of water droplets present in oil by a lift in the baseline of the infrared absorbance spectrum. Figure 1 illustrates different types of FluidScan spectra of used turbine oil samples with increased levels of water contamination.
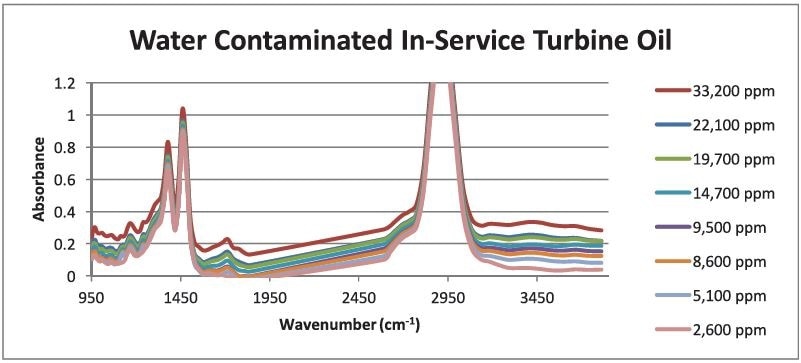
Figure 1. FluidScan spectra of used turbine oil heavily contaminated with water used to monitor a vacuum dehydration process at a power generation plant
The degree of light scattering caused by a water-in-oil mixture relies on the concentration of water there, but it also is greatly influenced by the way in which the water is physically dispersed in the oil: the size and number of discrete water droplets present in the oil as illustrated in Figure 2.
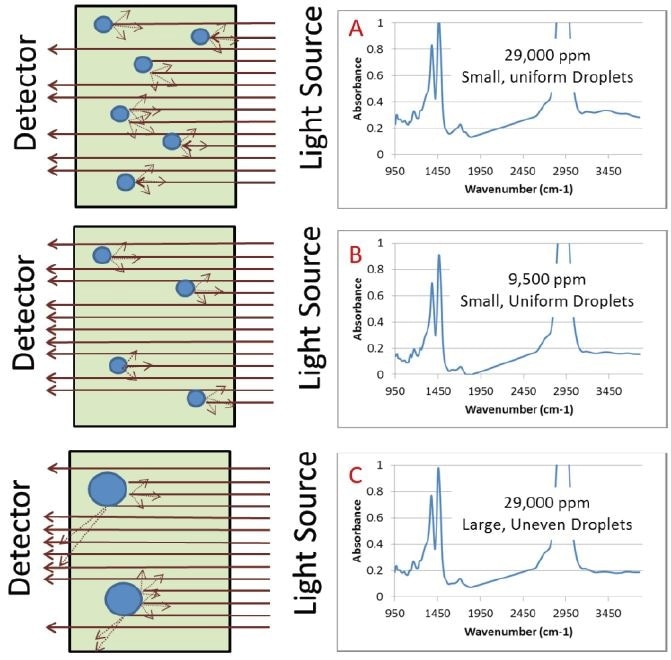
Figure 2. Graphical representation of light scattering in used turbine oil due to varied water droplets. Spectrum A is a used turbine oil with 29,000 ppm water contamination immediately analyzed after homogenization. Spectrum B is a used turbine oil with 9,500 ppm water contamination immediately analyzed after homogenization. Spectrum C is the same sample as in A (29,000 ppm) but has been allowed to sit for 45 minutes after homogenization. The change in concentration and water droplet size is apparent in the degree of baseline lift.
Therefore, it is vital to have representative, homogeneous sampling. At the sampling site, a portable instrument such as the FluidScan can be used for instant results where the water and oil will be homogeneous due to the tumultuous motion within the instrument. If the samples are allowed to settle, perhaps during transit to a laboratory or designated oil analysis site, the water will sooner or later separate as shown in Figure 3. After the water has fully separated from the oil, it is complicated to obtain an accurate measurement of the water content.
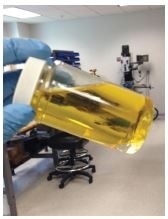
Figure 3. Sample of used Chevron GST 32, as received after shipment from a power generation plant
Method
A new water calibration, which measures light scattering because of the presence of water droplets, is provided on the FluidScan for the Industrial Library. The technique was created with water-contaminated samples of numerous popular brands of turbine and gear/bearing oils for a strong universal calibration of industrial fluids ranging from 1,000 ppm up to 65,000 ppm water. A vital component of the technique is the employment of a homogenizer. Figure 4 shows the samples were homogenized with a commercially available mechanical homogenizer and allowed to rest at room temperature for two minutes (no more than 30 minutes) before measurement on the FluidScan.
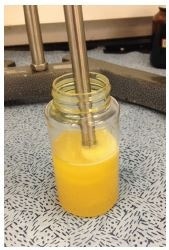
Figure 4. Homogenizing a sample of water contaminated oil
Results
Sixteen samples from the range of 500 ppm to 10,000 ppm water contamination were used to test the Total Water FluidScan measurement against Karl Fischer D6304. Each sample was prepared by homogenizing them for 30 seconds on high before analysis. They were measured concurrently on three FluidScans and by Karl Fischer to decrease the effects of sampling errors. Figure 5 shows the results.
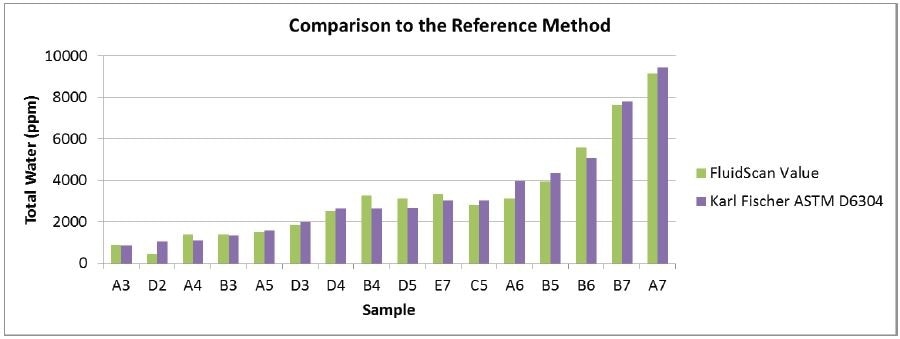
Figure 5. Comparison of the new total water measurement on the FluidScan to ASTM D6304 Karl Fischer titration method
To show the homogenizer’s importance in the determination of industrial fluids which are meant for outstanding water separability, a test set made up of 13 in-service Chevron GST 32 oil samples from a power generation plant were tested with and without suitable homogenization.
Figure 6 shows GROUP A, where samples were homogenized for 30 seconds on high. Prior to analysis, the sample bottles were gently inverted 20 times to blend.
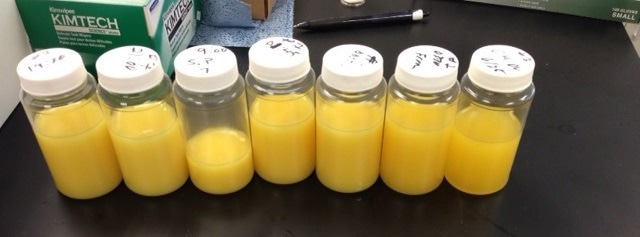
Figure 6. Samples shown after being homogenized for 30 seconds on high
Figure 7 shows GROUP B, where samples were shaken strongly by hand for 30 seconds and then left to rest for several minutes in order for air bubbles to dissipate. Prior to testing, the sample bottles were gently inverted 20 times to blend.
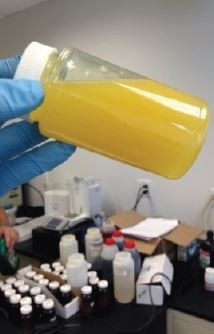
Figure 7. Sample which was shaken vigorously by hand for 30 seconds. To the eye, the opacity looks similar to the homogenized samples even though the water is not uniformly dispersed in the sample.
A plastic disposable pipette was filled from the middle portion of the bottle, and the same aliquot was used to dispense fluid into KF vials and onto the FluidScan flip-top cell. The results can be viewed in Figure 8.
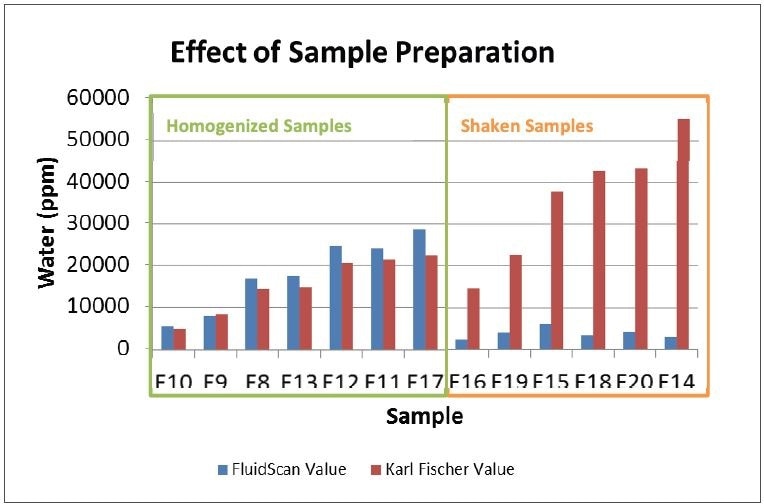
Figure 8. The samples prepared with a homogenizer showed great agreement between the calculated water concentration on the FluidScan and Karl Fischer result. The samples that were shaken by hand were not accurate.
Evidently, the sample preparation technique has a large influence on the results. All samples prepared only with strong hand-shaking (Method B) had an unacceptably huge number of errors, and in fact, never measured more than 6,000 ppm water on the FluidScan. Although the hand-shaken sample looked opaque, similar to the homogenized samples, a hand-shaken blend of oil with water is not actually homogenous. For at site analysis, a fresh oil sample measured directly at the sampling site should be homogeneous with even water droplet size from the turbulence and shearing within the machine.
In turbine oils particularly, the critical limit for water contamination is in the range ~ 500 ppm. Since the measurement is sensitive to baseline drift, in order to offer the required precision in this range there must be immense care taken in backgrounding the instrument before measuring each sample. At a minimum, a fresh background must be taken prior to every measurement. Furthermore, a few cleanliness thresholds that search for the presence of residual oil in the cell must be implemented. It may also be helpful to take an “air” background and an “empty cell” background.
Measurements of Mobil DTE 732 samples with increasing quantities of water contamination present were taken on a number of spectrometers over several days. Samples were measured in randomized duplicates on each unit on each device, homogenizing the sample for 60 seconds each time before measurement on the FluidScan and by KF. The average results (Figure 9) received over the four days of testing for a single spectrometer, Unit 1, shows the superior linearity of reaction to the technique.
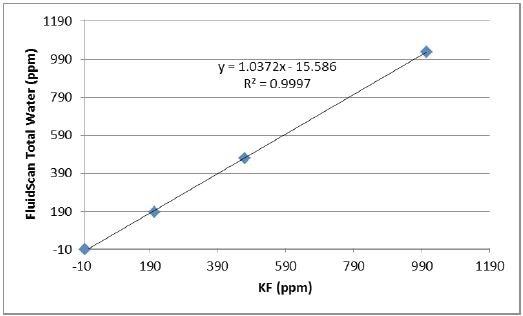
Figure 9. Average water result for each Mobil DTE 732 sample over four days obtained on Unit 1
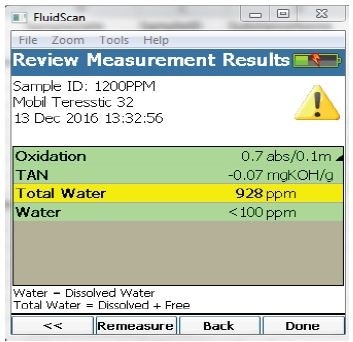
FluidScan measurement result for a turbine oil with severe water contamination
Comprehensive results for all measurements performed on all five FluidScan units are illustrated in Table 1. On each individual unit, the repeatability over the several days of testing was exceptional, on average 100 ppm (1*STD). The technique performed well on all five units with reproducibilities of <150 ppm (1*STD) for each measurement. It is clear to see that actionable data can be acquired in the range of 500 to 1000 ppm.
Table 1. Results from multiple days of testing samples of Mobil DTE 732 with varying water contamination levels are shown here.
| Day Measurement |
Sample A, KF = 0 ppm |
Sample B, KF = 205 ppm |
Sample C, KF = 470 ppm |
Sample D, KF = 1005 ppm |
| Unit 1 |
Unit 2 |
Unit 3 |
Unit 4 |
Unit 5 |
Unit 1 |
Unit 2 |
Unit 3 |
Unit 4 |
Unit 5 |
Unit 1 |
Unit 2 |
Unit 3 |
Unit 4 |
Unit 5 |
Unit 1 |
Unit 2 |
Unit 3 |
Unit 4 |
Unit 5 |
| 1 |
1 |
0 |
158 |
0 |
0 |
94 |
244 |
244 |
297 |
270 |
240 |
343 |
428 |
506 |
390 |
536 |
1139 |
1038 |
1164 |
1223 |
1061 |
| 2 |
0 |
0 |
0 |
78 |
76 |
136 |
167 |
324 |
297 |
163 |
481 |
470 |
437 |
400 |
103 |
1060 |
1081 |
1204 |
1299 |
1117 |
| 2 |
1 |
9 |
239 |
85 |
156 |
66 |
183 |
201 |
286 |
122 |
233 |
494 |
404 |
561 |
601 |
423 |
915 |
909 |
1281 |
1134 |
1098 |
| 2 |
71 |
27 |
207 |
213 |
0 |
160 |
264 |
183 |
373 |
200 |
705 |
496 |
808 |
675 |
657 |
942 |
962 |
1075 |
1092 |
1156 |
| 3 |
1 |
101 |
0 |
82 |
85 |
23 |
170 |
0 |
279 |
276 |
91 |
238 |
110 |
409 |
353 |
394 |
988 |
823 |
1020 |
1212 |
857 |
| 2 |
0 |
0 |
50 |
67 |
0 |
234 |
141 |
83 |
312 |
298 |
428 |
387 |
621 |
603 |
354 |
1132 |
1079 |
1056 |
1253 |
1143 |
| 4 |
1 |
0 |
0 |
0 |
0 |
80 |
36 |
0 |
130 |
115 |
0 |
309 |
348 |
436 |
457 |
453 |
941 |
655 |
1007 |
906 |
749 |
| 2 |
78 |
54 |
131 |
195 |
127 |
61 |
33 |
339 |
107 |
109 |
505 |
345 |
416 |
536 |
466 |
841 |
617 |
1059 |
1023 |
894 |
| AVE |
33 |
60 |
69 |
99 |
59 |
153 |
131 |
240 |
234 |
167 |
438 |
373 |
524 |
502 |
424 |
995 |
895 |
1108 |
1143 |
1010 |
| STDEV |
41 |
84 |
69 |
77 |
43 |
74 |
107 |
96 |
104 |
96 |
145 |
119 |
137 |
118 |
160 |
107 |
183 |
97 |
131 |
154 |
Conclusion
The new FluidScan technique for investigation of water contamination in turbine oils is a powerful, reliable technique provide an immediate alert of severe water contamination. The largest contributor to the disparity is the sampling. Hand-shaking is not enough for gaining a homogeneous sample and dependable results for water measurement on the FluidScan. Instant on-site analysis or the preparation of samples before analysis with a commercially available homogenizer is proposed for the best results. With a best practice sampling method, results correlating within 20% to Karl Fischer can be accomplished. The new FluidScan water calibration provides accurate assessment of the total water contamination in 90% of the industrial library for >300 ppm water in turbine oils and >1000 ppm water in other oils.
Reference
1 ASTM D6304 reference

This information has been sourced, reviewed and adapted from materials provided by AMETEK Spectro Scientific.
For more information on this source, please visit AMETEK Spectro Scientific.