Many complex fluids, such as surfactant mesophases, network forming polymers, emulsions etc. do not flow until the applied stress crosses a certain critical value, called the yield stress. Materials showing this behavior are considered to be exhibiting yield flow behavior. The yield stress is thus defined as the stress that must be applied to the sample before it begins to flow. Below the yield stress, the sample will deform elastically (just like stretching a spring), above the yield stress the sample will flow like a liquid [1].
Most fluids exhibiting a yield stress can be considered as having a structural skeleton extending throughout the whole volume of the system. The strength of the skeleton is governed by the structure of the dispersed phase and its interactions. Normally, the continuous phase is low in viscosity, but hig-volume fractions of a dispersed phase and/or powerful interactions between components can increase the viscosity by a thousand times or more and prompt solid like behavior at rest [1, 2].
The system is subjected to strain hardening when a solid-like complex fluid is sheared at low shear rates and below its critical strain. This is characteristic of solid-like behavior and results from elastic elements being stretched in the shear field. When such elastic elements approach their critical strain, the structure starts to break down resulting in shear thinning (strain softening) and consequent flow. The stress at which this catastrophic breakdown of the structural skeleton occurs refers to the yield stress and the associated strain refers to the yield strain.
It is possible to depict this process using mechanical analogs (Figure 1) using a spring in parallel with a dashpot (or damper) for a viscoelastic solid, and a dashpot and spring in the case of a gel. In both cases, the material cannot deform plastically (or flow) as it is restricted by the spring, which must first be broken. In the case of a viscoelastic solid, the yielded material will act like a Newtonian liquid, while for the gel, yielding will result in a viscoelastic liquid displaying shear thinning behavior. These are simple analogs and frequently more complex spring/dashpot combinations are needed to describe real materials.
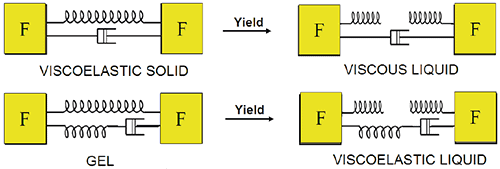
Figure 1. Illustration showing mechanical analogs and associated yielding for a viscoelastic solid and a gel.
Obviously, it is not possible to see dashpots and springs when looking at real microstructure via a microscope but the real components responsible for this behavior. In the case of emulsions and foams, this solid-like behavior occurs due to tight or ordered packing of the dispersed phase, while in polymer gels, for instance, molecular interaction or association is mostly responsible.
Regardless of yield stress clearly being apparent in a variety of daily activities such as dispensing ketchup from a bottle or squeezing toothpaste from a tube, the concept of a true yield stress is still a topic of much debate [3-8]. While an entangled polymer system and a glassy liquid will behave like a solid when deformed rapidly, at longer deformation times these materials exhibit properties of a liquid and thus do not have a true yield stress. According to Barnes et al [3], all materials are capable of creeping or flowing in a similar manner on long enough timescales and as a result a number of materials, which are considered to have a true yield stress, are actually extremely high viscosity liquids. For this reason, the term apparent yield stress is extensively used and is considered to represent the critical stress at which there is a distinct drop in viscosity.
This key characteristic is depicted in Figure 2 with a material comprising of a true yield stress displaying an infinite viscosity approaching zero-shear rate and a material with an apparent yield stress exhibiting a zero-shear viscosity plateau. The distinction really needs to be made at low shear rates (representing long times) since within a limited shear rate range, the material may seem to have a yield stress but at much lower shear rates it could be possible to observe a shear viscosity plateau. It is, however, important when making such distinction that measurement artefacts such as thixotropy, wall slip and instrument resolution are considered.
Although the concept of a critical stress or an apparent yield stress as opposed to a true yield stress is true for many materials, there is strong proof to suggest that this is not the case for all materials [4-6]. What does this matter? For short time processes such as stirring, pumping and extrusion not that much, however, for longer-term processes such as those impacted by gravity, sedimentation for instance, then establishing the presence of a true yield stress can be important [9].

Figure 2. Illustration showing an expected flow curve for a material with a true yield stress and a zero shear viscosity (left) and a material which appears to have a yield stress but shows viscous behavior at much lower shear rates (right).
The determination of a yield stress as a true material constant can be difficult as the measured value can be largely dependent on the measurement technique employed and the conditions of the test. As a result, there is no universal method for establishing yield stress and there exists a number of approaches, which find favor across different industries and establishments [10, 11].
Time is one such variable that can affect the measured yield stress value. Many complex fluids are thixotropic in nature and can change structurally with time of applied shear and/or take a finite time to recover after yielding. This can be particularly important when loading samples before measurement since this process often requires yielding the material first [12, 13]. Timescale or frequency of testing is also vital since viscoelastic materials may respond differently based on the relaxation behavior of the material and rate of deformation [8].
Micro-structural relaxation processes are best analyzed using dynamic testing on a rotational rheometer with inverse frequency correlating with time. Figure 3 shows some typical frequency spectrums and their mechanical analogs. Since G' is the modulus related to elasticity (and molecular or particle association) then when this value exceeds the viscous modulus (G"), which is related to flow, the material can be considered to have an associated structure and thus a yield stress.
Hence, for a material to have a true yield stress, G' must exceed G" at infinitely low frequencies, which would be the case for a viscoelastic solid and an ideal gel. For a viscoelastic liquid, the material will just appear to yield in the frequency range where G' exceeds G" and therefore these materials can be considered to have an apparent yield stress or critical stress. It is common for real materials to show elements of all these types of behavior over a wide frequency range, but because of measurement and time constraints it is often only possible to observe a limited frequency range.
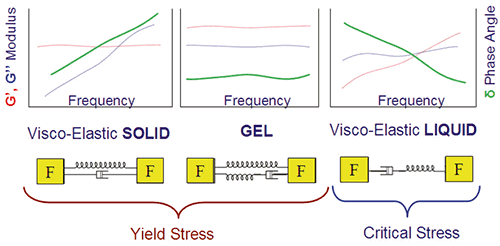
Figure 3. Illustration showing some typical frequency profiles for materials with a yield stress/critical stress and their mechanical analogs.
Temperature is another important factor. At higher temperatures, material components have more thermal energy and hence a lower stress input is needed in order to initiate flow. Therefore, yield stress tends to decrease with increasing temperature so long as there is no thermally-induced structural enhancement at high temperatures [1].
Different methods are available for measuring the yield stress of a material ranging from accurate rheometric techniques to some cruder non-absolute techniques. Some examples of non-absolute tests employed in industry include the Slump Test, which deals with measuring the degree of slumping of a cylindrical volume of material on a horizontal plane [13] and the Inclined Plane Test, which focuses on measuring the equilibrium sample thickness on an inclined surface following an initial, period of flow [15].
For this article, the focus will be on techniques available for use with a rotational rheometer, of which there are several available methods including stress ramp, creep, stress growth, model fitting and oscillatory techniques. An in-depth summary of each technique will be provided along with some discussion regarding best practice for making measurements and how to avoid measurement artefacts, particularly regarding wall slip.
Yield Stress Methods
Model Fitting
The standard method for measuring yield stress on a rotational rheometer or viscometer was by fitting models to the measured rheograms (shear stress versus shear rate data) and then extrapolating to zero shear rate [2]. The Bingham model, the simplest of these models, is often used to describe the behavior of concentrated suspensions of solid particles in Newtonian liquids. These materials frequently show an apparent yield stress followed by nearly Newtonian flow above the yield stress. The Bingham model can be written mathematically as:
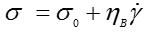
where σ0 is the yield stress and ηB is the plastic viscosity or Bingham viscosity. It should be noted that the Bingham viscosity is in fact not a real viscosity value, it simply describes the slope of the Newtonian portion of the curve.
The Casson model is an alternative model to the Bingham model. This model has all components in the Bingham equation raised to the power of 0.5, and subsequently has a more gradual transition between the yield and Newtonian regions. It tends to fit many materials better than the Bingham model and is extensively used to characterize inks and chocolate in particular. The Casson equation can be written as,
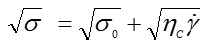
where σ0 is the yield stress and ηC is the Casson viscosity, which relates to the high shear rate viscosity.
The Herschel-Bulkley model is another yield stress model. Unlike the Bingham equation, this model describes non-Newtonian behavior after yielding and is fundamentally a power law model with a yield stress term. The Herschel-Bulkley equation is written as follows;
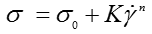
where K refers to the consistency and n is the shear thinning index. The latter term describes the degree to which a material is shear thickening (n > 1) or shear thinning (n < 1).
Figure 4 illustrates stress-shear rate curves for a Herschel-Bulkley and Bingham type fluid. It should be noted that these are presented on linear scaling but will have different profiles when displayed logarithmically, which is how such curves are generally represented.
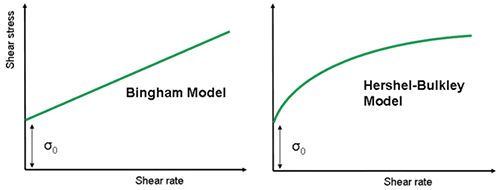
Figure 4. Illustration of Bingham and Herschel-Bulkley model fits using linear scaling.
To determine which model is most appropriate, it is necessary to measure the steady shear stress over a range of shear rates and fit every single model to the data. The correlation coefficient is then considered to be a good indicator of the goodness of fit. However, the range of data used in the analysis can have a bearing on the results obtained since one model might better fit the low shear data and another the high shear data better.
It should be noted that yield stress values determined by model fitting are frequently termed dynamic yield stresses when compared to the static yield stress attributed to other methods such as stress growth and stress ramps. The dynamic yield stress is defined as the minimum stress needed for maintaining flow, while the static yield stress is defined as the stress needed for initiating flow and is frequently higher in value. Generally, it is considered better to measure the static yield stress when looking at initiating flow in a material, that is, pumping, while dynamic yield stress may be more suitable in applications for stopping or maintaining flow after initiation.
There are additional models that can be employed for estimating the yield stress, or more appropriately, the critical shear stress for materials comprising of a zero-shear viscosity. These additional models are improved versions of the Ellis and Cross models for viscosity versus shear stress and viscosity versus shear rate data, respectively.
The Ellis model can be written as follows:
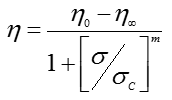
where η is the viscosity, η0 is the zero-shear viscosity, σ is the stress and σC is the critical shear stress. The critical shear stress refers to the stress at which the onset of non-linearity takes place and is fundamentally the asymptotic value of the shear stress at infinite viscosity assuming power law behavior (Figure 5). The exponent m is a shear thinning index, which refers to a measure of the degree of non-linearity, and η∞ is the infinite shear viscosity (limiting value of viscosity at very high shear rates).
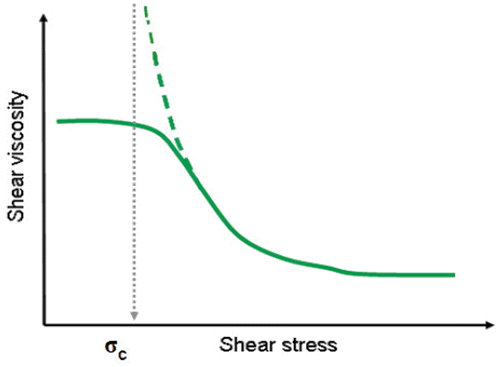
Figure 5. Illustration showing an Ellis model fitted to the flow curve of a shear thinning liquid.
Stress Ramp
One of the easiest and quickest methods for measuring yield stress on a stress controlled rheometer is to perform a shear stress ramp and determine the stress at which a viscosity peak is observed (Figure 6). Before this viscosity peak, the material undergoes elastic deformation and hence the strain rate is almost constant despite the fact that the stress is increasing linearly. This peak in viscosity signifies the point at which the elastic structure breaks down (yields) and the material begins to flow. This coincides with a rapid increase in shear rate and a subsequent reduction in viscosity.
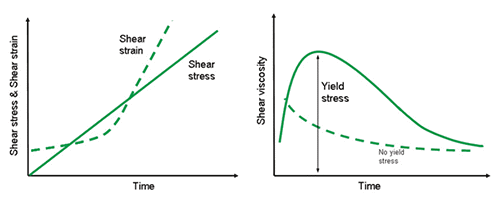
Figure 6. Shear stress-strain curve (left) and corresponding viscosity-stress curve (right) for materials with and without a yield stress.
In this test, the stress ramp rate can be an important factor since yield stress can be a time dependent property. It is thus essential to use a constant or standard value when comparing between samples.
Stress Growth
In a stress ramp test, a continuously increasing stress is applied and the resultant strain rate shear rate monitored with time. Conversely, a stress growth test involves applying a continually increasing strain (constant shear rate) and monitoring the stress build-up with time. Below its critical strain, the sample is subjected to work hardening resulting from elastic elements being stretched in the shear field.
When such elastic elements reach their critical strain, the structure starts to break down causing shear thinning (strain softening) and subsequent flow. This event corresponds with a peak value in shear stress, which is equivalent to the yield stress, before leveling off to its equilibrium value. This is illustrated in Figure 7.
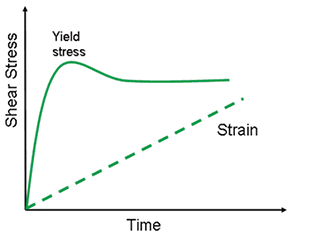
Figure 7. Illustration showing the stress evolution of a yield stress material at constant shear rate.
Typically, a low shear rate is applied in these tests to account for time relaxation properties of the material, although different shear rates can be used based on the application of interest. Rapid processes such as dispensing take place on short timescales, and therefore correspond with higher shear rates, while stability to sedimentation/creaming occurs over longer times and is better assessed at lower shear rates. Since yield stress is commonly a time-dependent property, the measured values can be different, however, a shear rate of 0.01s-1 is normally used and has been found to give good agreement with other yield stress approaches [17].
Oscillation Amplitude Sweep
This test requires employing an increasing oscillatory stress or strain and observing the corresponding alterations in the elastic modulus (G'), or the elastic stress (σ') with increasing amplitude. There are various ways of inferring yield stress from an amplitude sweep, as illustrated in Figure 8. Some look at the initial drop in G' as a measure of the yield point since this signifies the onset of non-linearity and hence structural breakdown, while others consider the G'/G" cross-over to be the yield point since this signifies the transition from solid to liquid like behavior [16]. The zone spanning these two events is frequently referred to as the yield zone since it signifies the transition from solid to liquid like behavior.
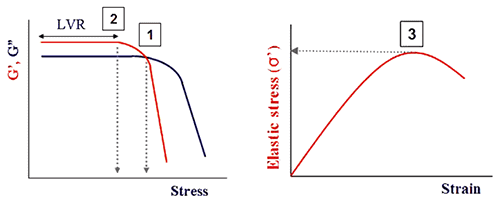
Figure 8. Illustration showing points commonly used to determine the yield stress and strain from an oscillation amplitude sweep.
A more recent technique for establishing yield stress through oscillation testing requires measuring the elastic stress component (σ'), which is linked with the elastic modulus (G'), as a function of strain amplitude [17, 18]. The yield stress is considered to be the peak value of the elastic stress, and the corresponding strain value the yield strain. This stress value usually falls between the values corresponding to the G'/G" crossover and the preliminary drop in G'. It has been revealed to give a more dependable measurement of the yield stress and correlates well with other techniques [17, 18].
It is important to note that test frequency can impact the measured yield stress based on the relaxation behavior of the material under test. Since G' normally decreases with decreasing frequency for complex fluids, yield stress is inclined to follow a similar trend. While lower frequencies will provide a better indication of a material’s properties at rest, performing an amplitude sweep at such low frequencies can significantly raise the time of the test.
Therefore, values between 0.01 and 10 Hz are generally used depending on the application of interest. Attention must be paramount when using serrated parallel plate for instance since the geometry is oscillating around a fixed position and can potentially leave voids in the material [19].
Multiple Creep
One of the most accurate techniques for establishing yield stress is a multiple creep test. This requires performing a series of creep tests using a variety of applied stresses and looking for alterations in the gradient of the compliance versus time curve. Based upon the nature of the material being analyzed, the response can be quite different as shown in Figure 9.
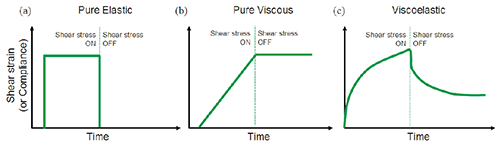
Figure 9. Illustration showing the strain response to an applied stress for (a) purely elastic material (b) purely viscous material (c) viscoelastic material.
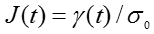
Since the real change of strain will be dependent upon the applied stress, it is typical to consider the compliance rather than the strain. The creep shear compliance (J) can be established from the preset shear stress (σ) and the resulting deformation (γ) through:
Applying this notion, creep curves produced at different stresses can be directly compared. All J(t) curves overlap with each other independent of the applied stress if the stress is within the linear viscoelastic region and below its critical stress and critical strain. When this criterion is not met, the material is considered to have yielded. From Figure 10, it can be deduced that the material under test has a yield stress between 3 and 4 Pa, as at 4 Pa the curve no longer overlays the lower stress data. To achieve a more precise estimate of the yield stress, it would be essential to repeat the test with small incremental increases in stress between these two values.
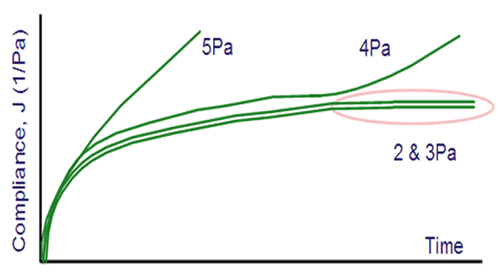
Figure 10. Illustration showing a multiple creep test with yielding at 4 Pa.
Again, test time can be important as also shown in Figure 10, where yielding happens only after a particular time at 4 Pa and yet instantly at 5 Pa. This again is due to many materials being structurally dynamic. Normally a test time ranging from 2 to 10 minutes is typically adequate for such a test, but longer times can be required if the material relaxes over a longer period. Allowing the material to relax between creep tests is crucial also or else stresses will be retained in the sample rendering artificially low values for the yield stress. This can be attained by applying a relaxation step between creep tests, which involves employing a zero stress for a time at least equivalent to the creep time.
Tangent Analysis
Tangent analysis is another common technique for defining yield stress, which can be applied in both oscillatory and steady shear methods (Figure 11). In oscillatory tests, if a single tangent is applied to the linear region of the curve, then the yield stress is repeatedly taken as the stress at which the curve starts to deviate from this tangent. This is essentially the end of the linear region, which is labeled 1 in Figure 8. The more common use of tangent analysis is to apply tangents to the flow region and the linear viscoelastic region, with the yield stress being the stress value at which the two tangents cross.
Mosty of the time, tangents are fitted to the stress-strain data as opposed to modulus-strain data, although the values should be equal. This same treatment can be employed to a steady shear stress ramp also, as illustrated in Figure 11(a). It is recommended that when fitting tangents for defining yield stress, the data should be plotted logarithmically since most yielding materials exhibit power law behavior.
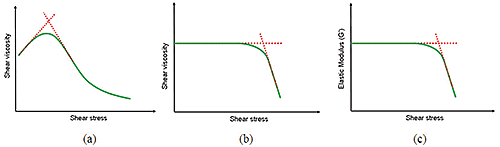
Figure 11. Illustration showing yield stress/critical stress determination by tangent analysis using steady shear testing (a and b) and oscillation testing (c).
Measurement Systems
Wall Slip
The choice of measuring system is vital when making any rheological measurement and particularly when measuring yield stress. When capturing shear rheological measurements on structured liquids; in particular emulsions, suspensions or foams, there is a high probability that the measurement may be affected by an occurrence known as 'wall slip'. Wall slip usually results from a local depletion of the dispersed phase near the geometry wall, which effectively forms a lubrication layer at the surface. Therefore, bulk rheological properties are no longer being accurately measured resulting in an underestimation of the yield stress and the true viscosity. A similar effect can be noticed when measuring stiff solid like materials where there is inadequate friction between the sample and the wall to support the applied stress [18, 21, and 22].
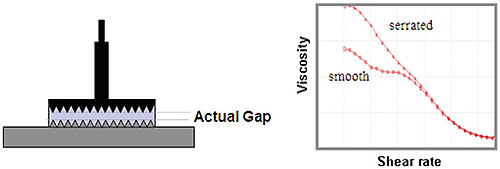
Figure 12. Illustration of serrated parallel plates used to minimize slip and associated data for a flow curve of a dispersion measured with smooth and serrated plates.
Wall slip can be counteracted in several ways, most commionly by use of serrated or roughened geometries, which efficiently take the geometry motion into the bulk of the liquid, greatly increasing sample-sample contact at the expense of sample-wall interactions. The degree of roughness usually depends on the size of any dispersed matter and the stiffness of the material, with serrated plates typically preferred for large particles and stiffer samples.
Figure 12 illustrates the consequence of wall slip for a concentrated particle suspension, as measured using smooth parallel plates. The apparent 'dog leg' (or kink) in the flow curve is a familiar feature of wall slip, which in this case is mainly eliminated using serrated plates.
Cone and Plate Measuring Systems
When using a plate set-up on a rheometer it is preferable to use a cone measuring system. This is because the shear stress is fundamentally the same over the whole cone surface and hence the material must yield homogenously across the sample radius. With a parallel plate, the measured stress is a function of the applied shear rate, which differs with radius. Hence, sample exposed to the plate’s outer radius will yield before that in the central zone and accordingly in some tests a plate may give marginally different results.
Roughened cones are available to reduce the effects of slip, but if the sample has large particles and/or needs a serrated system because of extensive slippage then a parallel plate may be the only solution to correct measurement using a plate set-up. The gap employed in such tests can also be vital since slip effects are typically more widespread at small gaps. This is due to the difference between slip velocity and geometry velocity; slip velocity remains constant as the gap gets smaller but geometry velocity decreases [1].
When working with certain materials, especially paste like materials, there may be limits on the working gap that can be used to attain accurate yield stress measurements. This is because such materials can display inhomogeneous flow behavior when larger gaps are used and can result in partial yielding or fracture across the gap. This is usually visually obvious, with close examination revealing two different layers moving at different speeds and a characteristic inflection on the shear stress-shear rate curve.
Cylinder and Vane Measuring Systems
When using a cylinder set-up on a rheometer, vanes and splined geometries can be used to reduce slip and work in a similar manner to the serrated plate systems. The former is often recommended for concentrated dispersions and emulsions, which are susceptible to slippage, since this maximizes sample-sample contact [20-22]. Another advantage of the vane tool is that it can be inserted into the sample with minimal disturbance to the structure. This can be crucial as many complex fluids are thixotropic and may take a finite time to recover their structure after loading or in certain cases not at all. The vane can also potentially be used with the product in its original container, dimensions permitting, which means there will not be a need to transfer the sample to a measurement cup, which again prevents structural damage before measurement.
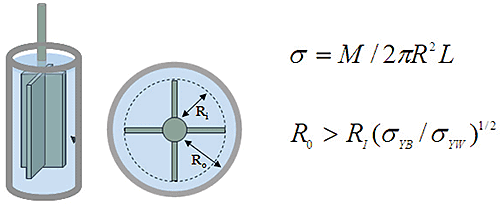
Figure 13. Illustration of vane tool in a smooth cup and associated stress equation. M is the torque and L the vane length; σYB is bulk yield stress and σYW the wall yield stress.
When using a cup and bob system or the vane tool for measuring yield stress, it is vital that the measurement is made at the vane edge or bob wall as opposed to the midpoint position, which is the standard (ISO3219; DIN53019) for viscosity measurement. This is because the stress decreases with radial distance from the bob surface and hence yielding will primarily occur at the bob surface [20, 23]. When using the vane tool, the rotating vane will circumscribe a path in the sample and thus can be considered to act like a cylindrical bob that is comprised of sample, as illustrated in Figure 13.
As sample is in contact with sample, minimum slip is met at the periphery of the vane but if the surface of the cup is not profiled then there is the chance that the sample may slip or yield at the outer wall surface before the sample itself yields. Since stress reduces with inverse radius from the bob/vane surface, using a larger measuring gap can curtail such effects. A splined or serrated cup or basket may also be used [22, 23].
Concluding Remarks
Yield stress is an important parameter for characterizing a wide range of complex fluids, and is a crucial factor many of real-life processes and applications involving such materials. So as to obtain applicable, robust and reproducible yield stress data for a specific material, it is vital to make an evaluation of both the test type and the measurement protocol used to do the test. It is this background knowledge and consistency of approach that will make a difference to gaining consistent yield stress measurements.
References
- Larson, R.G (1999), The Structure and Rheology of Complex Fluids, Oxford University Press, New York
- Macosko, C.W (1992), Rheology Concepts, Principles and Applications, Wiley-VCH
- Barnes, H.A, Walters, K, (1985), The yield stress myth? Rheol. Acta., 24 (4), 323 -326.
- Barnes, H.A (1999), The yield stress: a review or 'παυτα ρεΙ' -everything flows? J. Non-Newtonian Fluid Mech., 81, 133-178.
- Evans, I. D (1992), ''On the nature of the yield stress,'' J. Rheol. 36, 1313-1316.
- Schurz, J (1990), The yield stress - An empirical reality, Rheol. Acta.,29 (2), 170-171
- Hartnett, J. P. and Hu R.Y.Z (1989), "The yield stress-an engineering reality," J. Rheol. 33, 671-679
- Spaans, R.D, Williams, M.C (1995), At last, a true liquid-phase yield stress, J. Rheol. 39, 241
- Duffy, J.J, Hill, A.J (2011), Suspension stability;Why particle size, zeta potential and rheology are important, Proceedings of Particulate Systems Analysis, Edinburgh, UK
- Nguyen, Q. D. & Boger, D. V (1992), Measuring the flow properties of yield stress fluids. Annu. Rev. Fluid. Mech., 24, 47-88
- Stokes, J. R. & Telford, J. H. (2004). Measuring the yield behavior of structures fluids, J. Non- Newtonian Fluid Mech., 124, 137-146
- Cheng, D.C.-H (1986), Yield stress: a time dependent property and how to measure it, Rheol. Acta 25 54
- Moller, P. C. F., Mewis, J., & Bonn, D (2006). Yield stress and thixotropy: on the difficulty of measuring yield stresses in practice. R. Soc. Chem., 2, 274-283
- Pashias N, Boger DV, Summers J, Glenister DJ (1996), A 50 Cent Rheometer for Yield Stress Measurement, J. Rheol. 40, (6), 1179-1189
- Uhlherr, P.H.T, T. Fang and Z. Zhou (1999), Determination of Yield Stress from Initiation of Motion on an Inclined Plane, Min. Pro. Ext. Met. Rev. 20, 93-114.
- Shih, W. Y, W.-H. Shih, W.-H, Aksay, I. A (1999) Elastic and yield behavior of strongly flocculated colloids, J. Am.Ceram. Soc. 82, 616-624
- Yang, M. C, Scriven, L.E, Macosko, C.W (1986), Some rheological measurements on magnetic iron oxide suspensions in silicone oil,' J. Rheol. 30, 1015-1029
- Walls, H.J, Caines, S.B, Sanchez, A.M, Khan, S.A (2003), Yield stress and wall slip phenomena in colloidal silica gels, J. Rheol. 47 (4), 847
- Castro, M, Giles, D.W, Macosko, C.W, Moaddel, T (2010) Comparison of methods to measure yield stress of soft solids, J. Rheol. 54 (1), 81
- Barnes, H.A & Nguyen, Q. D. (2001). Rotating vane rheometry - a review. J. Non-Newtonian Fluid Mech., 98, 1-14.
- Buscall, R, McGowan, I.J, Morton-Jones, A.J (1993) ''The rheology of concentrated dispersions of weakly attracting colloidal particles with and without wall slip,'' J. Rheol. 37, 621-641.
- Barnes, H.A (1995), ''A review of the slip ~wall depletion! of polymer solutions, emulsions and particle suspensions in viscometers: Its cause, character and cure,'' J. Non-Newtonian Fluid Mech. 56, 221-251.
- Buscall, R, MSACT Consulting (2006), Malvern Panalytical Webcast 1/17/06 'Measuring and Interpreting the Yield Stress of Colloidal Dispersions'

This information has been sourced, reviewed and adapted from materials provided by Malvern Panalytical.
For more information on this source, please visit Malvern Panalytical.