Hyaluronic acid (HA) is considered to be a naturally occurring, unbranched polysaccharide that comprises of alternately repeating D-glucuronic acid and N-acetylglucosamine units. This biopolymer exists in all mammalian systems but occurs mainly in synovial (joint) fluid, vitreous humor and different loose connective tissues (such as rooster comb) (1). HA is of enormous commercial interest for medical, pharmacological, ophthalmic and cosmetic applications.
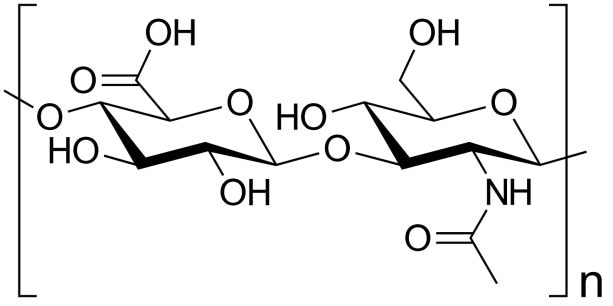
Figure 1. Hyaluronic acid is a natural polymer important in biology and commercial applications.
Hyaluronic acid has been extensively studied (1–7). The physiochemical behavior of HA has been tied closely to material characteristics such as the molecular weight distribution (also called polydispersity index [PDI]), intrinsic viscosity ([η]), weight-average molecular weight (Mw), and molecular conformation.
Previous studies of HA have included a number of size-exclusion chromatography (SEC) experiments. Standard SEC deals with chromatographically separating samples, monitoring the output with a concentration detector such as a UV absorbance detector or a refractometer and relating the elution time to molar mass. SEC in this form is considered to be a purely relative measurement, since the chromatographic system must initially be calibrated with a series of known molar mass standards in order to produce a calibration curve. The accuracy of the calibration relies on the analyte containing the same conformation and column interactions as the reference standards.
Other SEC studies of HA have integrated multiangle light-scattering (MALS) devices in series with concentration detectors. This proves to be beneficial because SEC-MALS is a very sensitive technique for measuring absolute molar masses that does not depend on calibration standards or a priori assumptions about the molecular conformation. With SEC-MALS, it is possible for one to determine a sample’s root mean-square radius Rg, provided the sample Rg is greater than about 10 nm.
At the Istituto di Chimica delle Macromolecole (Milan, Italy), the Mendichi group carried out several elegant experiments involving SEC-MALS of HA with the addition of online, single-capillary viscometry (2,3). This combination of detectors produces not only all of the aforementioned material characteristics but also clarifies sample intrinsic viscosity and, using the Mark–Houwink–Sakurada (MHS) relationship, molecular conformation.
However, single-capillary viscometry is essentially vulnerable to noise produced by system pressure fluctuations. Single-capillary viscometry detector S/N of only approximately 125:1 has been shown even with the use of a pulse-free pump and Fourier-transform data filtering (8,9). Another disadvantage of this technique is its reliance on calibration using a great number of recognized standards.
Differential viscometry is mainly beneficial when compared to single-capillary viscometry, as will be shown. This article presents SEC-MALS-IV for absolute determination of HA properties using differential refractometry, MALS, and differential viscometry detectors in series with SEC separation.
Materials and Methods
Samples
Seven distinct HA samples were used for this study. HA sources included umbilical cord, rooster comb and bacterial fermentation. Ovalbumin was attained from Sigma (St. Louis, Missouri). All other chemicals were analytical grade.
Analytical Instruments
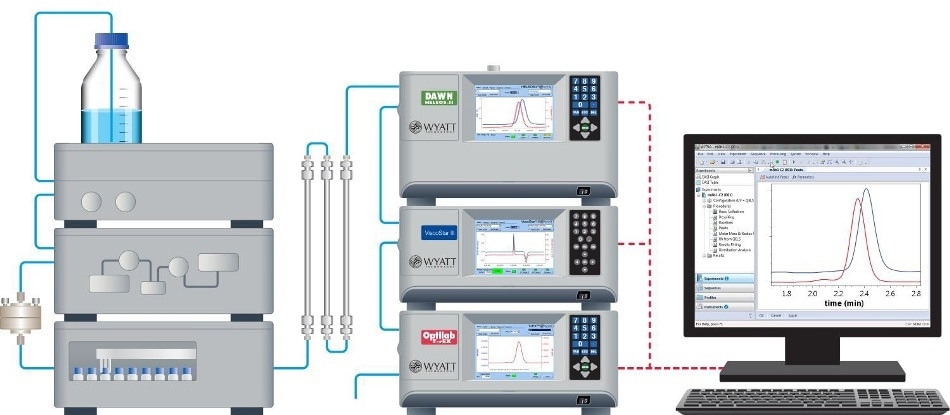
The chromatographic system comprised of an HPLC system and autoinjector (Agilent 1100 [Agilent Technologies, Wilmington, Delaware], 900 μL injection loop) along with a solvent degasser (ERC L761). The SEC column system comprised of a Polymer Labs (Amherst, Massachusetts) Aquagel - OH (8 μm) separation column with guard column. The mobile phase was phosphate-buffered saline (PBS, 8 mM dibasic sodium phosphate, 22 mM monobasic sodium phosphate, 150 mM sodium chloride in doubly deionized water). The flow rate was 0.5 mL/minute. Chromatographic detectors included a DAWN® MALS device, a ViscoStar® differential viscometer, and an Optilab® differential refractometer in series (all from Wyatt Technology, Santa Barbara, California).
All solution concentrations were 0.1 mg/mL HA in PBS. The injection volume was 900 μL. The dn/dc value for HA, 0.167 mL/g, was obtained from the literature (1). The low concentration and large injected volume were selected in order to prevent potential viscous-fingering of HA samples within the separation column. Injections were carried out multiple times for each sample in order to verify repeatability of results.
The MALS detector determines absolute molar mass without the need for column calibration, reference standards, or “fudge factors.” The differential refractometer was used for concentration measurements. Thermal control through a Peltier device allows thermal stability at or below room temperature, and thus stable baselines and very high S/N.
Differential Viscometry
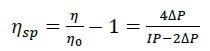
The differential viscometer uses the standard four-arm capillary bridge design (Figure 2). The bridge is made up of four equal-impedance capillaries with the lower-left arm possessing an effectively zero-impedance delay volume. As mobile phase propagates through the device, the differential pressure (ΔP) transducer in the center of the bridge reads zero. When the sample enters the bridge, it evenly splits. When the sample enters the delay volume, three capillaries contain sample and one contains just mobile phase. This produces a pressure imbalance within the bridge that is detected by ΔP. The sample specific viscosity (ηsp) can be determined directly from the combination of this ΔP pressure imbalance and the device inlet pressure (IP) by means of the subsequent relationship as obtained from the Stokes–Einstein equation (10):
 |
[2] |
Where η is the sample viscosity and η0 is the solvent viscosity.
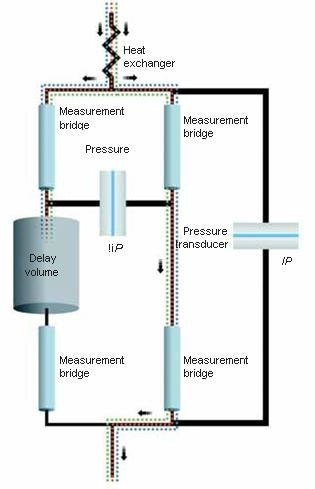
Figure 2. Schematic of the differential viscometer design.
This is a direct measurement that relies only upon calibrated pressure transducers. The bridge design is essentially insensitive to pressure fluctuations and thus is capable of tolerating moderate pump pulses. Furthermore, the device makes use of a Peltier thermoelectric device for precision thermal control within a huge temperature range, including at or below room temperature. The integration of precise thermal control, bridge design, and contemporary electronics results in a device with outstanding S/N. A more enhanced design has been described in ViscoStar III: Innovations in Online Viscometry for GPC.
Data Analysis
Experimental collection and data analysis were carried out with the ASTRA software package (Wyatt Technology). Employing this software allowed collecting and subsequently analyzing all 18 MALS angles along with the ΔP, IP, and differential refractometry signals.
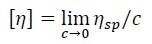
Knowledge of both ηsp as determined by the differential viscometer and concentration c as determined by the differential refractometer permit the direct calculations of intrinsic viscosity [η] using Equation 3, which is applied to every data slice across an elution peak.
 |
[3] |
The MALS detector offers molar mass data at each data slice as well, so the whole distribution can be fit to the MHS equation,
where M is molecular weight and K and a are MHS coefficients that correspond to solvent interaction and polymer shape. In particular, the a value is an indicator of polymer shape in solution, with lower a values (for instance, a < 0.5) signifying more compact conformations and higher a values (for example, a > 0.8) signifying extended conformations.
It is also possible to determine the hydrodynamic volume Vh of the sample from MALS and viscometry measurements by means of the Einstein–Simha relation:
 |
[5] |
where NA is Avogadro’s number. The hydrodynamic radius rh is calculated as
Defined this way, rh is the radius of a sphere that has the same [η] as the sample.
Band-Broadening Correction
As the sample travels through the detectors, each flow cell behaves like a small mixing volume. These distinct mixing chambers cause an initially sharp peak to broaden with a slight exponential tail. Left uncorrected, this leads to experimental results to be slightly distorted (10). Band broadening is present when more than one detector is employed for HPLC detection. The software employs a proprietary band-broadening correction algorithm, which is capable of solving the long-standing problem of inter-detector band broadening.
Results and Discussion
Table I summarizes the material characteristics established for the seven HA samples. Results are in agreement with published values (1–3,5).
Table I. Summary of HA sample material characteristics.
| HA Sample |
HA Source |
Mw
(g/mol) |
PDI |
Rg
(nm) |
[η]
(mL/g) |
rh
(nm) |
| HA-1 |
Bacterial fermentation |
2.64E+05 |
1.19 |
57.7 |
632 |
27.7 |
| HA-2 |
Umbilical cord |
2.84E+05 |
1.23 |
66.1 |
652 |
28.3 |
| HA-3 |
Chicken comb |
6.62E+05 |
1.10 |
109.1 |
1431 |
51.1 |
| HA-4 |
Bacterial fermentation |
1.10E+06 |
1.45 |
165.4 |
1754 |
57.7 |
| HA-5 |
Umbilical cord |
1.44E+06 |
1.06 |
180.4 |
2208 |
77.7 |
| HA-6 |
Chicken comb |
1.62E+06 |
1.06 |
182.4 |
2671 |
86.1 |
| HA-7 |
“ Natural sources” |
1.76E+06 |
1.02 |
207.9 |
2655 |
89.9 |
Figure 3 presents a typical ηsp chromatogram of an HA sample together with the associated Mw, Rg, and rh values across the peak. The typical differential viscometer S/N of the ηsp trace for these HA experiments was on the order of 2200:1, more than one order of magnitude better than pulse-free, data-filtered single-capillary viscometry.
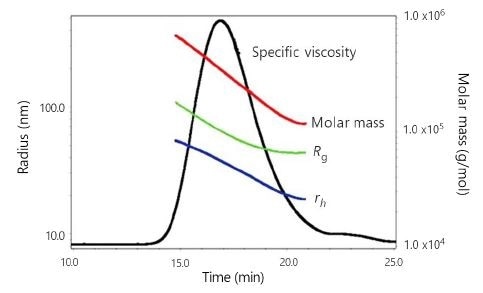
Figure 3. ηsp chromatogram of sample HA-2 with associated Mw, Rg, and rh values across the peak.
To assess molecular conformation information, MHS plots were developed for all samples. Figure 4 shows a representative MHS plot of sample HA-2. The least-squares regression of the MHS trace can also be seen in Figure 4. From this regression, the K and a values for sample HA-2 were calculated as K=0.0277 and a=0.817, both values being close to the published values. However, these numbers should not be considered at face value, as it can be seen that the MHS trace shows marked curvature. Though not shown, all seven HA samples tested within this research revealed MHS curvature similar to that observed in Figure 3. All HA MHS plots show curvature, and due to this the K and a coefficients as determined by direct linear regression of MHS plots cannot be considered as accurate descriptors of MHS behavior across the whole span of HA molecular weights. Indeed, this is true of earlier published K and a values.
By using a polynomial fit (in this case second order) of the MHS curve and consequently taking the derivative of that function, one can establish instantaneous a values (ai):
| ai = d(log[η] / d(logM). |
[7] |
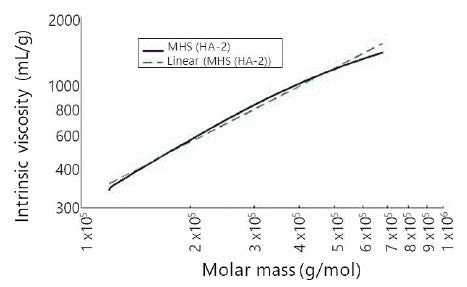
Figure 4. Mark–Houwink–Sakurada plot and linear fit for sample HA-2.
Figure 5 shows the ai values of sample HA-2, which range from 1.0 at lower molecular weights to nearly 0.55 at high molecular weights. The six other HA samples presented ai behavior similar to that described earlier, with typical ai values ranging from 1.1 at low molecular weights to 0.5 at high molecular weights.
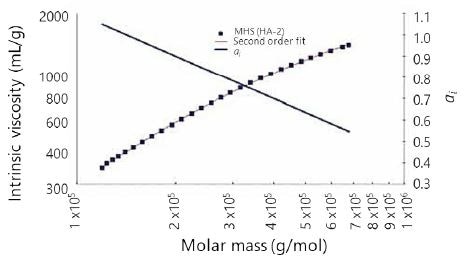
Figure 5. Mark–Houwink–Sakurada plot, second-order fit, and ai versus log(Mw) for sample.
This difference in a across its molar mass range signifies that HA presents free-draining, non-Gaussian chain behavior at lower molecular weights (2). The inbuilt stiffness of this polyelectrolyte forces the molecule to take on a more extended conformation at lower molecular weights, and thus a correspondingly high ai value. HA slowly transitions into standard Gaussian chain behavior and ai values drop as molecular weight increases. This could help explain the extensive variety (and inconsistency) of HA MHS constants that have been featured in the literature.
Conclusions
By incorporating a differential refractometer, a MALS instrument, and a differential viscometer with SEC, the material characteristics of the biopolymer HA were explored. The molecular weight distribution, absolute HA molecular weight, and radii information were found to be consistent with historical literature values. HA molecular conformation, as elucidated by MHS analysis, has been found to display unusual behavior, as shown earlier by the Mendichi group. Utilization of these detectors in combination with the software guaranteed accurate, rapid, absolute analysis of this behavior with unparalleled S/N and without any need for calibration curves for any of the detectors.
References
(1) S. Hokputsa et al., Eur. Biophys. J. 32, 450–496 (2003).
(2) R. Mendichi et al., Biomacromolecules 4, 1805–1810 (2003).
(3) R. Mendichi and A. Giacometti Schieroni, Polymer 43, 6115–6121.
(4) R. Mendichiet al., Polymer 39, 6611–6620 (1998).
(5) L. Solteset al., Biomed. Chromatogr. 16, 459–462 (2002).
(6) K. Kazuaki et al., J. Chromatogr. B 797, 347–355 (2003).
(7) N. Berriaud et al., Int. J. Biol. Macromolecules 16, 137–142 (1994).
(8) R. Mendichi and A. Giacometti Schieroni, J. Appl. Polymer Sci. 68, 1651–1659 (1998).

This information has been sourced, reviewed and adapted from materials provided by Wyatt Technology.
For more information on this source, please visit Wyatt Technology.