Spectral examination is now the norm in fundamental and applied research, in applications covering detection of chemicals, process instrumentation, characterization of novel materials, and disease detection. Spectroscopes are defined by two fundamental characteristics, namely, their bandpass and resolution. The first refers to the breadth of the frequency region that can be examined at the same time, while resolution denotes the finite size detected by the instrument using a delta function.
In the coarse measure, these properties are inversely related. A large bandpass enables many phenomena to be studied at the same moment. Resolution is important in obtaining information at low levels, such as individual ro-vibrational modes of a gas phase molecule with the help of a high-resolution IR spectrometer, which data can help understand its isotopic composition.
A high-resolution Raman spectrum could also help to record characteristic peaks in sufficient detail to differentiate two chemical substances whose vibrational profiles are similar. When LIBS (Laser Induced Breakdown Spectroscopy) is used, both high resolution and large bandpass are needed so that atomic spectral peaks may be spread out over a broader region, enabling the identification of a greater number of peaks.
Several factors influence the spectrographic resolution, such as grating line density, size of the entrance slit, optical properties of the spectrometer, its focal length, and pixel pitch. These are often fixed in a given configuration, so that the system’s focal length, for instance, cannot be easily enhanced without replacing the instrument, or making marked alterations to the optical elements or at least realigning them completely.
In contrast, just using a lower density of grating grooves can increase the bandpass, a simple process, especially when motorized multiple gratings turrets are used. However, each grating has only one combination of resolution with bandpass for a given system configuration. This is why there is a need for a way to change the resolution and the bandpass while preserving other spectrographic optical elements unchanged.
This article describes the TruRes™ which is an unmatched feature of the Andor Kymera 328i spectrograph that allows improvement of resolution in real time. Post-processing techniques may include peak fitting, spectral deconvolution or principal component analysis, all techniques which need data and system response assumptions to enable data interpolation at higher resolutions. This may lead to the development of artifacts that alter the information yield in either the positive or negative direction, as seen in Figure 3.
The fundamental aspect of TruRes is an optical element that allows spectral resolution to undergo true enhancement in the absence of mathematical alteration, changes in spectrometer components, or data processing, so that a single spectrograph setup can be used for a much wider and more useful range of spectral resolution. The spectrometer is thus much more flexible even while the operator can refine the resolution while maintaining the bandpass constant.
The TruRes uses a neon calibration source with authentic LIBS spectral data, to increase the spectral resolution by more than 30%. This brings it to the level of resolution achieved by a 500 mm spectrometer without reducing its bandpass, which is that of a 328mm instrument.
Both horizontal and vertical imaging planes show improved resolution and spatial separation respectively with TruRes enhancement. The use of 2D enhancement also enables greater hyperspectral track densities to be imaged while the resolution can be tuned across the whole sensor length.
Experimental Setup
The current experiment used a Kymera 328i imaging Czerny-Turner spectrograph (Andor Technology, Belfast, UK) which was enhanced using TruRes. The instrument had a plane reflectance grating set at 300 grooves/mm, with a 500 nm blaze (from Richardson, UK), and a toroidal collimating mirror which compensated for astigmatic aberration, to give a 328 mm focal length.
A multimode fiber bundle (100 um cores, NA 0.22) with 19 channels was used to couple light into the instrument, the bundle ending in a ferrule with a linear fiber stack, placed at the 50 micron entrance slit.
The camera used was a Newton 920 spectroscopic CCD camera which offered a resolution of 1024 x 255 pixels with a pixel pitch of 26 microns. It was connected to the Kymera 328i CCD camera (Andor Technology, UK) via the direct output port of the camera. The samples used comprised light from a neon calibration lamp (Ocean Optics, St. Petersburg, Florida) as well as atomic radiation from an LIBS steal sample.
Results and Discussion
For hyperspectral imaging, the spectrograph must be of imaging grade so that each spectral profile can be distinguished and characterized with sufficient accuracy. When point sources are imaged with a spectrograph, off-axis aberrations typically result, such as spherical aberration, oblique astigmatism and coma. These lead to the occurrence of out-of-focus or asymmetric blur patterns forming on the detector.
To compensate for this, optical corrections are made using the collimating mirror, which is usually a toroidal mirror for an imaging-grade spectrograph. Even so, as Figure 2 shows, Czerny-Turner spectrographs have image reproductions which are deviations from the ideal. This is less so when the instrument has a longer focal length because the operating F# is higher, which means the light has a smaller divergence cone and the off-axis rays are not so deep.
The heart of the TruRes™ is enhancement of resolution using a motorized iris which is carefully positioned so that the naturally diverging light passing to the inside of the input slit along the optical pathway is spatially filtered through the iris. A closed iris blocks the rays with an increased angle, which would otherwise cause aberrations. This increases the input f/#.
Figure 1 shows how the iris positions are calibrated so that changes in the position affect the input f/# as well as the spectral peak area. This means that the instrument now functions as one of longer focal length, with higher resolution of a point source image, but minimal blurring or asymmetric image production of the fiber bundle.
Figure 2 shows an image produced with a fully open aperture (f/4.1) compared to one with iris open to 30% (f/10.8). It is seen that a full vertically binned iris results in better imaging because of fewer aberrations, and this in turn causes improved spectral resolution, as can be seen in Figure 3.
This shows the neon images at 753.577 and 754.404 nm with a fully opened iris (F/4.1) to be a doublet without resolution, which improves to a pair of completely resolved peaks when the iris is closed to 50% (F/6.5).
On the other hand, the standard mathematical techniques that are used to fit gaussian instrument response functions to peaks in order to increase the resolution did not bring about this degree of individual peak resolution.
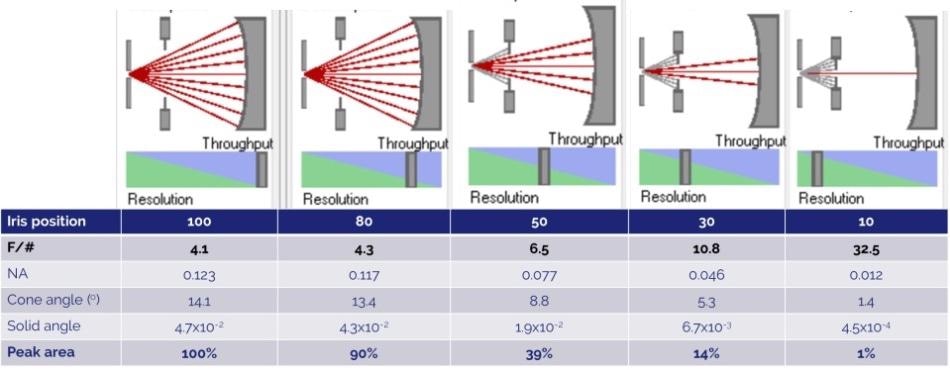
Figure 1. Representation of the mechanism of the TruRes™ iris. The iris is placed behind the input slit where input light is diverging. Closing the iris blocks oblique angle rays increasing the effective f/# of the input light. Iris diameter is calibrated to represent % open. The table below correlates iris position to effective f/#, numerical aperture, cone angle, solid angle and peak area % with 100% open equaling F/4.1.
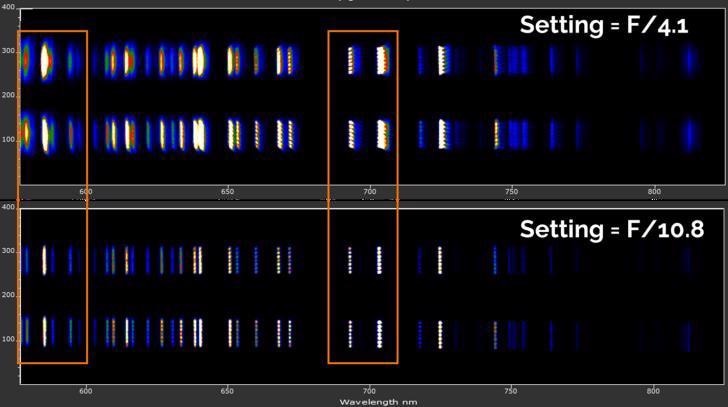
Figure 2. Comparison of 1st order diffracted image of lines from a neon calibration source coupled through 100 um core fiber stack at f/4.1 (100% iris) and f/10.8 (30% iris). Substantial improvement in image sharpness is seen at higher f/#’s.
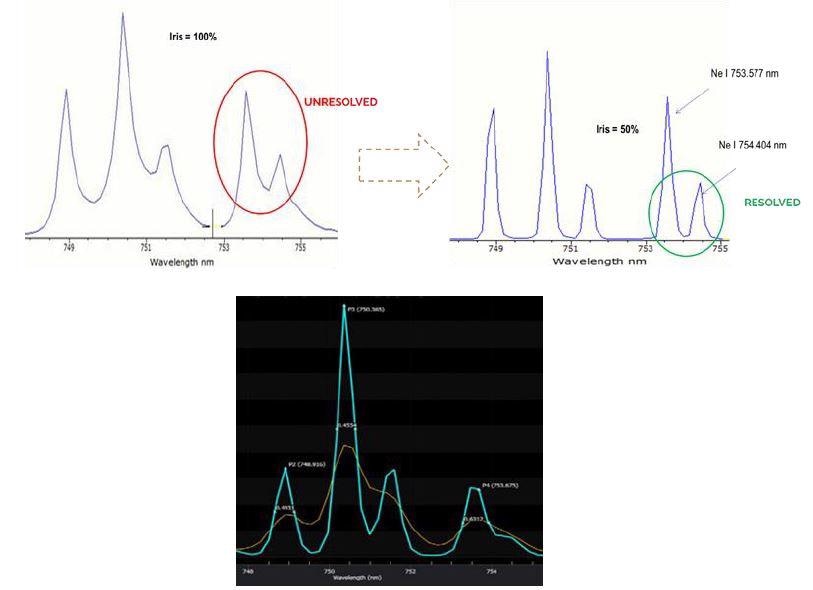
Figure 3. TruRes™ resolution improvement on 753 and 754 lines of Ne 1(top) compared with mathematical peak fitting algorithm (bottom).
When the iris is closed, the throughput decreases, but the relationship between the iris position and height of the spectral peak is nonlinear. This is because much of the decrease is from the edges of the input beam, a region which is prone to aberrations, and therefore does not significantly affect the peak intensity.
Most 1/3 meter spectrographs, to which class the Kymera 328i belongs, have a diverging beam from a fiber or other point source at the focal plane of the input which propagates at f/4.1 to such an extent as to overfill the grating with its collimated area. The increase from f/4.1 to f/5.1 thus does not cause any significant loss of throughput, as Figure 4 shows.
Any further loss of throughput will be sigmoidal rather than linear, and the wider the iris opening, the smaller the throughput losses, assuming the intensity of distribution to be Gaussian, as in Figure 5.
During iris narrowing, there is better imaging in both spatial planes, and increase in f/#. A mercury-argon calibration source connected to the 10 nm entrance slit of the Kymera 328i was used to study the increase in resolution using the 546-nm line.
As Figure 6 shows, the spectrograph was fitted with a 1200 l/mm grating and a Newton 920 CCD detector. With decrease in iris aperture, the spectral peak intensity, which is a measure of the throughput, is reduced, denoting a relative enhancement of resolution until the iris becomes very small.
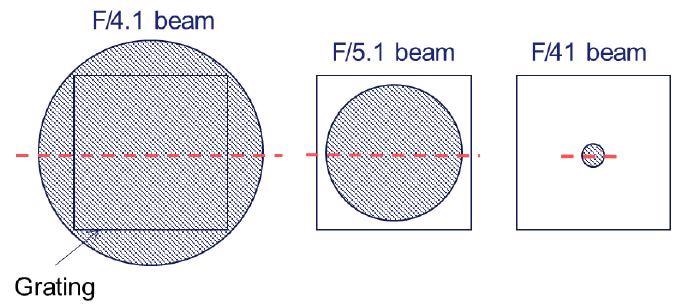
Figure 4. Effect of increasing F/# to assure the grating is not overfilled.
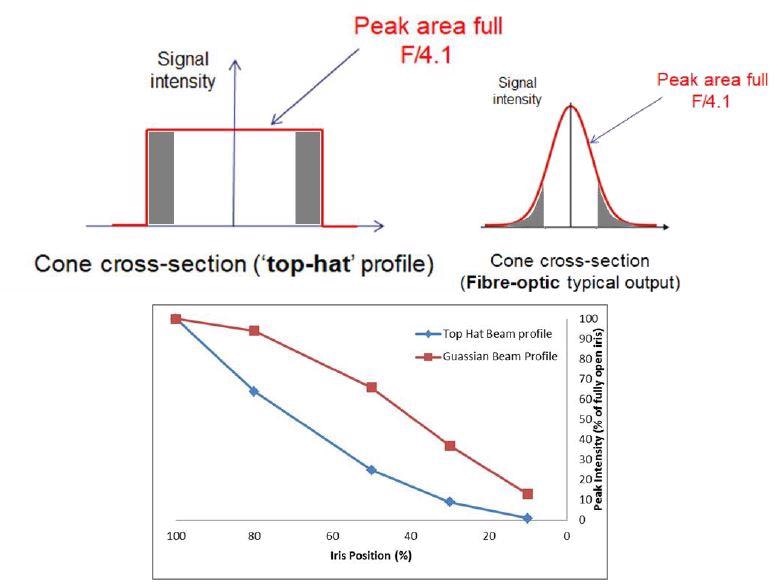
Figure 5. Comparison of effect of beam intensity profile on throughput decrease during iris closure sequence.
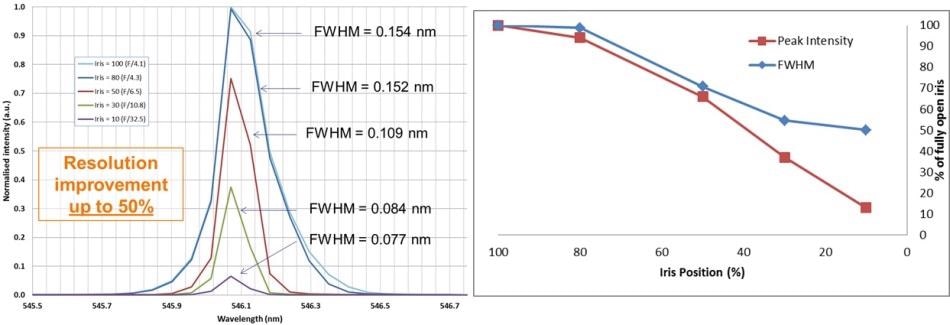
Figure 6. 546-nm peak of mercury-argon line calibration source at varying iris positions (left). The decrease in throughput in conjunction with an increase in resolution can be seen (right).
Better resolution was also seen with several other lines produced by the mercury-argon source, across the UV-Vis spectrum. This relative enhancement does not depend upon the region of the spectrum, i.e., UV to Vis to NIR, and the smallest FWHM does not occur at the smallest iris aperture, but at 20-30% of the fully open position, following which the FWHM plateaus, as Figure 7 shows.
The reason may be that the crossover point between the improvement in resolution because of lower aberrations, and the loss of resolution because of the illumination of fewer and smaller grating grooves is reached at this iris position.
In conclusion, a case study was performed of a steel sample which had undergone LIBS characterization. The TruRes feature corrected the aberration such that some spectral structures, which seemed to be peak shoulders of about 275 nm or buried components due to adjacent peaks (286.8 nm and 287.1 nm), became visible.
This helped to detect some trace components in the sample which might have been missed, or to compensate or avoid false positives and false negatives by applying extra criteria as required. This would increase the accuracy of algorithms used for identification.
It is clear that there is a clear reduction of throughput, but when techniques that employ high light levels are used, the ratio of signal to noise remains high, showing that this decrease does not cause a difficulty in the process (Figure 8).
The bandpass also remains constant with enhanced resolution, and this is more significant with respect to LIBS applications in which a wide range of atomic emission line wavelengths, about 500 nm, is typical, making it necessary to keep the bandpass large enough to maximize the coverage.
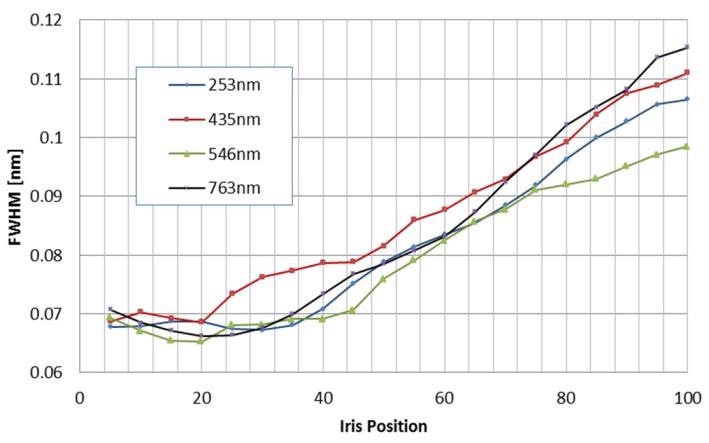
Figure 7. FWHM is shown as a function of iris position for 4 mercury-argon lines across different parts of the UV-Vis-NIR spectrum.
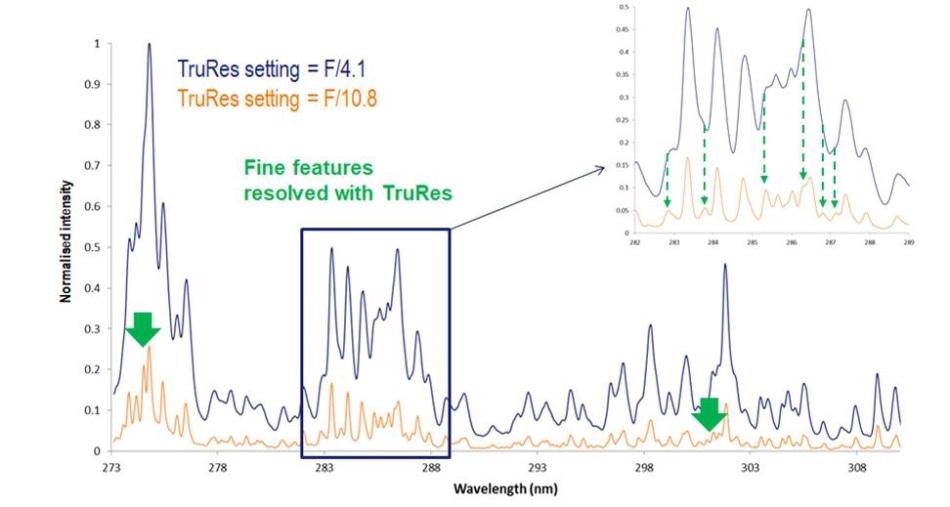
Figure 8. LIBS spectrum of steel TruRes™ iris positions of 100% and 30% corresponding to F/4.1 and F/10.8 respectively. Resolution improvement shows extra resolved structure called out by green arrows. Data is courtesy of Dr. Vincent Motto-Ros, Institut Lumiere Matiere (ILM), Lyon University.
Conclusion
This article describes the experimental demonstration of the characteristics of the TruRes enhanced resolution mechanism featured by the Kymera 328i imaging spectrograph from Andor.
The innovative placement of an iris behind the input slit, on the optical pathway, makes it easy to adjust the input f/#, and to prevent spherical aberrations by blocking the entrance of oblique rays through the slit. This improves the resolution by up to 50%. This is done with the same configuration, that is, the same grating and spectrometer focal length, which means that an instrument with shorter focal length or a grating with smaller line density and therefore a larger bandpass can be used to get better results.
To illustrate, the Kymera 328i has an FWHM measured at about .08 nm with a 1200 l/mm grating when the iris is closed to an ideal position. A spectrometer of 500 mm focal length would have an FWHM measured at almost the same resolution, that is, about 0.07 nm, if the same grating line density was present.
However, the bandpass of the latter would be about 38 nm but the Kymera 328i would have a 50% larger bandpass of 58 nm. This advantage is offset only slightly by the small decrease in throughput, because if the resolution could be increased with this level of reduction in throughput, many applications with a greater photon flux would be possible, since many chemicals could be accurately identified and distinguished in this way.
References and Further Reading
- Petrak, B, Deju, N, Muller, A. “Purcell-enhanced Raman Scattering from Atmospheric Gases in a High-finesse Microcavity”, Phys. Rev. A, 89(2), 023811, (2014).
- Hopkins, J., Cooper, J. T., Profeta, L. T., Ford, A. R., “Portable Deep-Ultraviolet (DUV) Raman for Standoff Detection”, Appl. Spec., 70(5), 861, (2016).
- Morgan, P. K., Scott, J. R., Jovanovic, I., “Hybrid interferometric/dispersive atomic spectroscopy of laser-induced uranium plasma”, Spectrochim Acta B, 116, 58, (2016).
- Born, M, Wolf, E, “Principles of Optics”, Pergamon Press, New York, (1980).
- Palmer, C “Diffraction Grating Handbook”, Newport Corporation, Rochester, (2014)

This information has been sourced, reviewed and adapted from materials provided by Andor Technology Ltd.
For more information on this source, please visit Andor Technology Ltd.