Sponsored by HORIBAJun 12 2018
Ratiometric fluorescence is a method where the intensities at two or more wavelengths of an emission spectrum or excitation are measured in order to detect changes to a local environment. This is generally achieved using a specialized probe that is sensitive to a specific environmental parameter such as pH, polarity, viscosity or ion concentration.
Ratiometric Dyes
The use of ratiometric dyes for locating probe-sensitive properties, like ion concentration, can be used by measuring kinetics or spectra.
Within Fura-2’s spectrum it is possible to see that the fluorescence excitation has two peaks. These peaks directly reflect the binding of free ionic calcium in solution. At high free ionic calcium concentrations the excitation peak of 340 nm is relatively high. When the free ionic calcium concentration is low, the excitation peak at 380 nm is increasing in relation to the peak at 340 nm.

Figure 1. Fluorescence excitation spectra of Fura-2 in solutions containing 0 to 3.4 μM free Ca2+. (HORIBA PTI QuantaMaster Series, 2017)
Examining the ratio of the intensities at two excitation wavelengths from these peaks, it is possible to see that this directly correlates with the intracellular concentration of free ionic calcium.
Furthermore, by measuring the ratio of the fluorescence at 510 nm when excited at 340 nm and 380 nm over, time will provide a time-based plot of how the solution is changing in calcium cation concentration. This method is used to measure the cellular uptake of free ionic calcium.
Fluorescence Spectra
Other probes exist that have fluorescence spectra which change in the same way, with physical properties such as the concentration of other ions (for example, sodium, magnesium and potassium) and solvent polarity pH.
The graph above highlights this ratio, showing how intracellular calcium responds to an atrium cell that is loaded with Fura-2. In this instance, by examining the ratio between the two intensities over time it is possible to correlate the concentration of calcium ions with this kinetics curve.
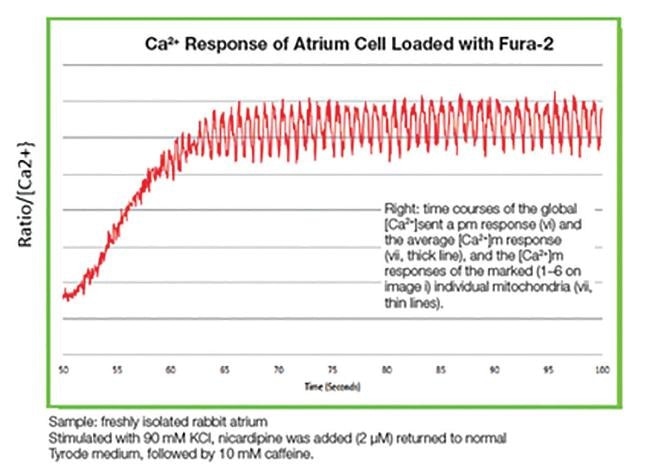
Figure 2. Ca2+ response of atrium cell loaded with Fura-2

This information has been sourced, reviewed and adapted from materials provided by HORIBA.
For more information on this source, please visit HORIBA.