The analysis of macromolecules and polymers is most frequently carried out using the technique of Gel Permeation/Size Exclusion Chromatography (GPC/SEC). As the technique has increased in popularity there has been pressure for further advances in efficiency, i.e. shorter run times and reduced required volumes of solvent and sample.
Advanced Polymer Chromatography (APC™) instruments have been designed to address this need – they possess low volume columns with advanced pumps, which can supply the higher pressure needed for columns packed with extremely small particles. Whilst APC systems provide more efficient analyses, they must still be calibrated for the determination of relative molecular weights.
This problem has been solved by a form of sideways development – the development of advanced detectors such as viscometers and light scattering detectors, which can be used under these conditions. When used alongside APC technology these detectors facilitate the efficient, full characterization of a sample.
OMNISEC REVEAL from Malvern Panalytical
The OMNISEC REVEAL detector range for use in Malvern Panalytical’s OMNISEC represents the pinnacle of these advanced detectors. The system has been designed to function at APC conditions, i.e. low band broadening and high pressures, with Waters’ ACQUITY APC.
To demonstrate that the benefits from the advanced detectors in the OMNISEC REVEAL and the efficiency gains from using the ACQUITY APC complemented each other, the analysis of two polymers, with different structural profiles, was carried out. The experimental goal was to collect a large enough volume of characterization data to be able to determine if a polymer sample has linear or branched structure, and to collect this data within a few minutes.
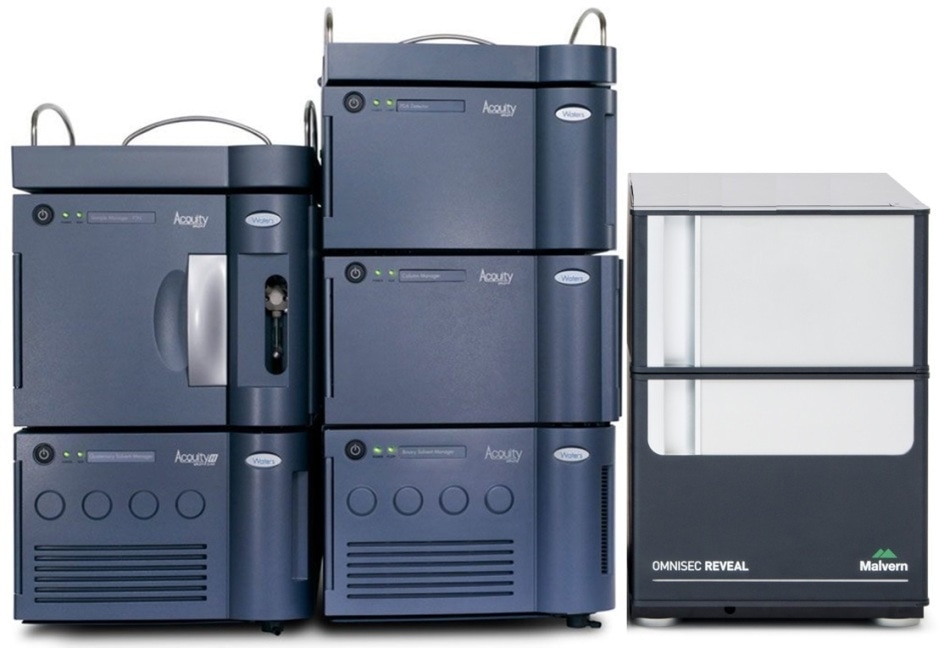
Figure 1. The ACQUITY APC from Waters and OMNISEC REVEAL from Malvern
Panalytical.
The two different polymer samples (A and B) were prepared and then analyzed. THF was used as the mobile phase, supplied at a rate of 1.0 mL per minute, and the sample was run through three 150 mm ACQUITY APC XT columns in series – 45 Å, 125 Å, and 450 Å.
- Polymer A had a concentration of 1.31 mg/mL and was introduced to the system through a 19 µL injection, to give a total mass of 24.9 µg.
- Polymer B had a concentration of 1.92 mg/mL and was introduced to the system through a 14 µL injection, to give a total mass of 26.9 µg.
These small volumes and masses are in stark contrast to the volumes required using conventional GPC/SEC, which are in the range of 300-500 µg per sample injection. Conventional analysis requires more sample be to injected as the columns have a far greater volumes, which results in peaks which are far broader than the precise peaks given when using an APC column.
As a means of comparing the ACQUITY APC-REVEAL’s efficiency in comparison to conventional GPC/SEC polymer samples A and B were also analyzed using two 30 cm GPC/SEC columns with a mixed bed.
Figure 2 (below) shows the refractive index chromatograms acquired for polymer samples A and B using the ACQUITY APC-REVEAL and conventional GPC/SEC. The large difference in the time required for analysis and the mobile phase are clear, as is the smaller peaks for the ACQUITY APC-REVEAL, which show less sample was used in the analysis. The high sensitivity of the OMNISEC REVEAL means that even with smaller peaks the signal quality does not suffer.
More than 20 mL of solvent was required in the GPC/SEC method to elute A and B (and produce the broad peaks in the process), whereas only 6 mL was required by the three APC columns used.
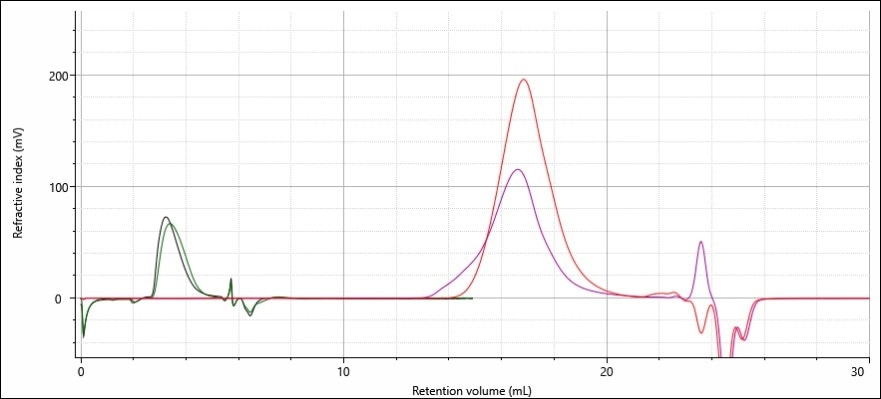
Figure 2. Refractive index chromatograms of the linear (red) and branched (purple) samples on two analytical 30 cm GPC/SEC columns overlaid with the same linear (green) and branched (black) samples analyzed using three APC columns.
Results and Discussion
Figures 3 and 4 show the chromatograms achieved using a triple detector set up (refractive index, viscometer and right angle light scattering) for polymer samples A and B.
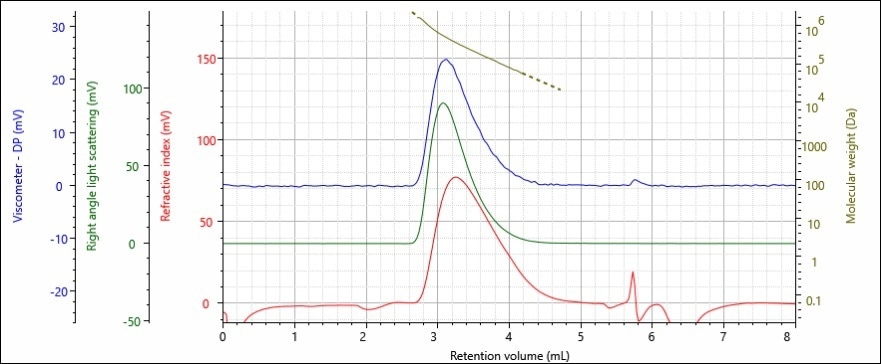
Figure 3. Triple detector chromatogram of polystyrene sample A; refractive index (red),
right angle light scattering (green), viscometer (blue) detectors and molecular weight
(gold) are presented.
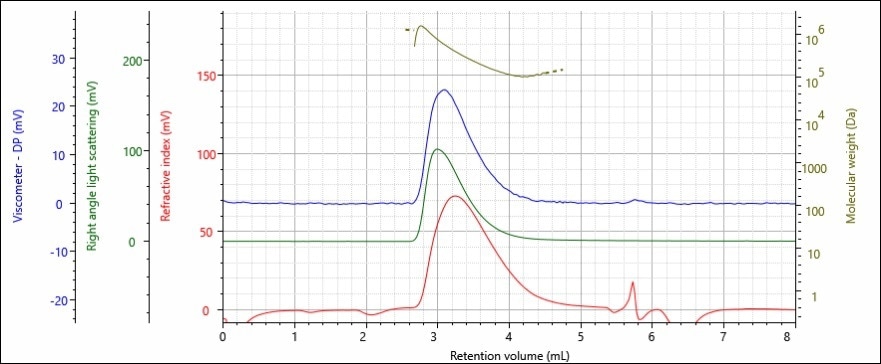
Figure 4. Triple detector chromatogram of polystyrene sample B; refractive index (red),
right angle light scattering (green), viscometer (blue) detectors and molecular weight
(gold) are presented.
The data shows that the detectors all provided a good signal to noise ratio, and that the chromatography was of a high quality – which can be inferred from the crisp return to the baseline following each peak. The samples molecular weight is provided above the peak demonstrating that larger (and therefore heavier) molecules eluted the faster, and at earlier retention volumes.
Both of the polymer samples display similar peak shapes on the chromatogram with volumes between 2.75–4.5 mL. Calibration curve analysis using a refractive index detector showed that the samples have similar molecular weights, as they were retained for similar amounts of time.
If the analysis was carried out using only just a refractive index detector this would be the only conclusion. The addition of the viscometer and light scattering detector provide a greater wealth of information, allowing further characterization of the structure of the samples. This data is shown in Table 1.
Table 1. Molecular characterization data for polystyrene samples A and B using multidetector analysis to generate absolute molecular weight.
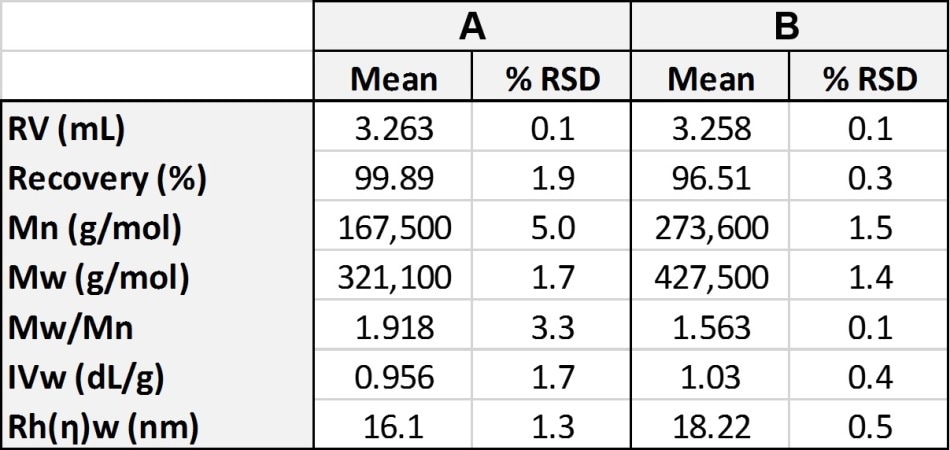
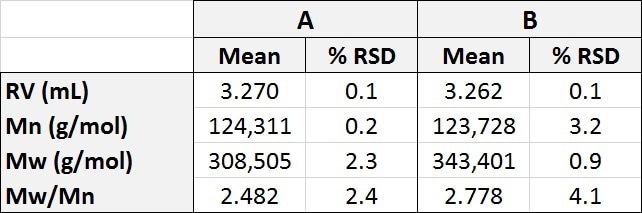
The similar retention volumes (RV) of polymer samples A and B are consistent with the similar values for the hydrodynamic radius (Rh) of both of the samples. As the hydrodynamic radius (i.e. size) of both of the samples are so similar that running a traditional calibration analysis, as shown in Table 2, gives the molecular weight of sample B as approximately 340,400 Da, which is only slightly bigger than sample A, and also consistent with the difference in Rh. However, when the data from the light scattering detector is included it is apparent that this conclusion is erroneous.
Table 2. Molecular characterization data for polystyrene samples A and B using conventional calibration analysis to generate relative molecular weight.
The data from the light scattering detector shows that in reality the polymer samples A and B have significantly different molecular weights (Mw) which are given as 321,000 Da and 427,500 Da. This large difference is interesting because the two molecules have similar hydrodynamic radii. Taking the intrinsic viscosity (IV) data from the viscosity detector explains this discrepancy.
The data provided by the viscosity detector shows that the two samples have extremely similar IV values – Sample A has an IV of 0.956 dL/g, and sample B has an IV of 1.03 dL/g, even though the samples have significantly different molecular weights.
As sample B has the greater molecular weight it must have a greater molecular density, i.e. contains more mass within the same amount of molecular volume. This means that for any given molecular weight of sample B, the IV for that weight will be less than the IV of sample A.
Mark-Houwink plots can be used to demonstrate the relationship between molecular weight and the IV. The Mark-Houwink method involves plotting the IV of the sample on the y-axis versus the molecular weight on the x-axis. If the relationship for different samples are plotted on the same graph the differences in sample structure become clear. Figure 5 shows the Mark-Houwink plots for two runs of samples A and B.
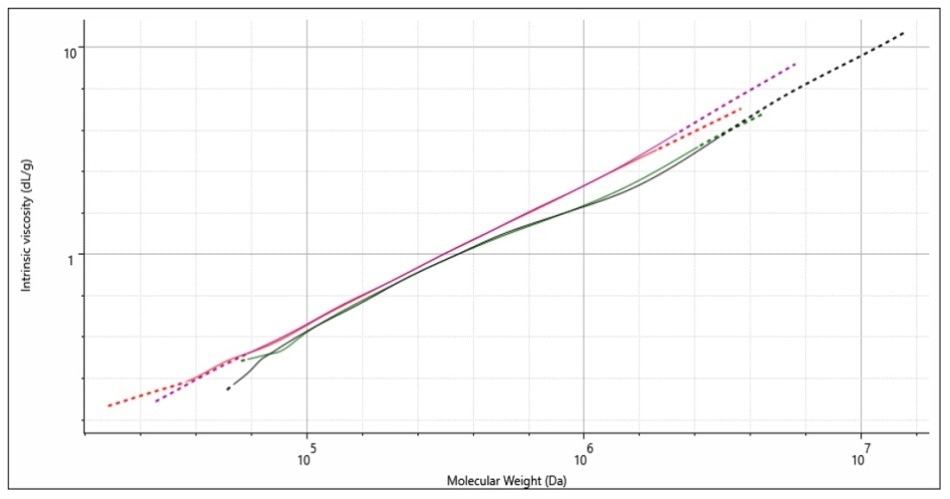
Figure 5. Mark-Houwink plots for two injections each of sample A (red & purple) and
sample B (green & black).
Polymers that have a consistent structure, regardless of their molecular weight, have a straight line form on the Mark-Houwink plot whereas different polymer samples which have similar structures will follow a similar trajectory.
Polymer samples that have variable structures appear to be stacked on the plot, with the densest polymers accumulated in the lower region of the plot. This is because a polymers molecular density is inversely proportional to its IV value.
The plot in Figure 5 shows that sample A (red plot and purple plot) has a linear structure, because there is a regular relationship between the molecular weight and the IV structure. The plots for sample B (green plot and black plot) show linearity up to a molecular weight of 400,000-500,000 Da, at which point the curve deviates from sample A’s linear plot and curves downwards.
This downward movement indicates a reduction in the IV, which means sample B is denser. The most common structural feature in polymers which causes density is polymer branching.
The conclusion of the Mark-Houwink plot, when also taking the rest of the data collected on polymers sample A and B, indicate that sample A is a linear form of polystyrene, and that sample B is a branched form of polystyrene.
This case study is a fantastic example of how just using conventional calibrated chromatography is not enough to make definite conclusions on analyte structure.
Sample A is a linear form of polystyrene, which matches the provided calibration values, meaning its absolute and relative molecular weights are in agreement. Whereas, sample B is a branched form of polystyrene whose absolute and relative molecular weights do not agree – this is because using a conventional method ignores the differences in its molecular structure.
Conclusion
Equipping the ACQUITY APC with the advanced and varied detectors in the OMNISEC REVEAL allows a comprehensive analysis of the structural differences of the polymer samples A and B to be carried out.
The samples were both evaluated, and it was found that they had similar retention volumes. Further analysis, using data from the viscometer and light scattering detector, was used to provide more insight into their differences. These differences, not indicated by retention volume alone, became clear by the drawing of a Mark-Houwink plot using the collected data.
The method was highly efficient, using only small sample and solvent volumes, and was carried out rapidly; reducing the time required to characterize the samples. This research shows the wealth of benefits to researchers and manufacturers of using the ACQUITY APC-REVEAL to characterize their samples.

This information has been sourced, reviewed and adapted from materials provided by Malvern Panalytical.
For more information on this source, please visit Malvern Panalytical.