Concerns over the limited availability of fossil fuels and greenhouse gas emissions have led, since 1975, to the enactment of U.S. government regulations, such as the Corporate Average Fuel Economy (CAFE), to control the fuel economy of cars and light trucks.
In June 2015, the Transportation Department and the Environmental Protection Agency (EPA) drafted standards for big truck carbon emissions w. Per these standards, all big trucks constructed in 2021 or thereafter should be up to 24% more fuel-efficient, and emit 24% less carbon emissions when compared to a similar truck built in 2018. Analogous recommendations and regulations are being made worldwide for all types and sizes of vehicles.
Due to these regulations, along with other efficiency, performance, and cost reasons, automotive manufacturers and their suppliers are consistently seeking different strategies to boost the fuel economy of diesel-powered and gas-powered vehicles. A major area of focus is the reduction of loss of energy relating to friction, usually known as parasitic energy losses.
Fuel efficiency is improved when less energy is wasted on frictional losses and more energy is available to drive the vehicle. It has been projected that approximately 10% of energy input is used up by friction and less than 15% of fuel energy is changed into useful energy that propels the vehicle.
The development of engineered surfaces of automotive components with low-friction and controlled surface topography has been reported to improve fuel efficiency by 3-5%.
Therefore, even a minimal enhancement in fuel efficiency translates to huge benefits, given the comparatively low rate of energy conversion of vehicles powered by diesel or gas. For instance, a 2010 U.S. EPA press release stated that even a 3 mpg increase in fuel economy is estimated to save one million barrels of oil every day, reduce emissions of carbon dioxide by 140 million tons every year, and save consumers a phenomenal $25 billion in fuel costs every year.
To accurately develop and produce engineered components with required surface conditions, appropriate technologies should be used to test and quantify surface properties. When engineered parts are tested under different conditions, real-world product functionality can be predicted. It is also necessary to quantitatively measure the roughness and texture of surfaces because these parameters have a major impact on the performance of systems.
Testing and Controlling Friction
Tribology is the science behind how wear, friction, and lubrication have an impact on interactive surfaces in motion. It is very difficult to control wear and friction. While materials’ friction coefficients are not absolute, they signify values acquired under specialized use conditions.
The environment of the system can influence the way a testing process is carried out and also impact the test results. Interpretation of the pressure, humidity, temperature, and other factors is crucial to engineering components that limit wear and tear or move more easily. For instance, there are several methods to decrease the friction between surfaces:
- The surfaces should be made smoother by minimizing the surface roughness by depositing super-smooth coating materials, for example, diamond-like carbon (DLC), or by utilizing finer surface finishing steps.
- Lubrication should be enhanced by using fluids that have improved additives and lower viscosity.
- The contact area between the surfaces should be reduced by using ball bearings.
Tribology testing systems can be utilized to perform standardized and customized tests under specialized use conditions to optimize the aforementioned improvements. Universal tribometers are capable of carrying out numerous tests in one platform with interchangeable modules, and can allow manufacturers to further interpret and manage the broad range of intricate parameters that affect the movement and wear of parts.
Characterizing Surface Topography
The surface topography of automotive components should also be measured and characterized. While tribology testing can denote the way a part is working, precise measurement of surface texture parameters can show why a certain part is acting in a certain manner.
With accurate surface metrology, engineers can further understand the numerous factors that impact the behavior of moving parts. It is important to understand the friction and wear of surfaces and their fundamental causes, to develop, produce, and maintain automotive components, like brake components, bearings, shafts, seals, etc.
One of the most precise, versatile, and repeatable techniques for precision surface metrology is three-dimensional (3D) optical microscopy that utilizes white light interferometry (WLI). Instruments built on this technology have been utilized to quantify the material surfaces in the automotive sector, research and development laboratories, QC/QA facilities, production lines, and manufacturing floors across a very wide range of applications.
Visualizing Surfaces with High-Fidelity Imaging
Apart from precision surface metrology, crisp imaging of the surfaces of samples serves major inspection needs in QA/QC.
The latest 3D optical microscopy technology has imaging capabilities with the display benefits and ease of use that are typically available only in confocal microscopy. This allows users to quickly and easily acquire repeatable and high-resolution surface topography measurements and also achieve 3D visualization of sample topography and high-quality images.
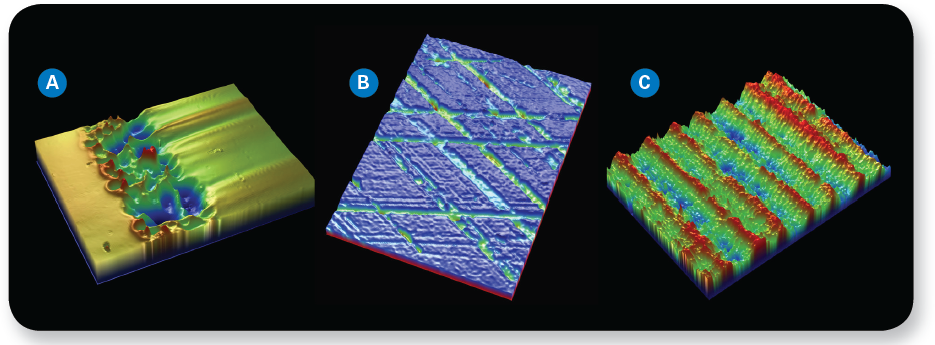
Figure 1. From left to right, 3D optical image revealing defect in chrome plating, 3D optical microscope image of honed cylinder wall functional surface, and 3D surface image of a brake rotor. Image Credit: Bruker Nano Surfaces.
Understanding the Complete Picture
Interactive surfaces should be tested against real conditions to gain a better understanding of the way they will perform. Such considerations affect everything from greenhouse gas emissions and fuel economy to the reliability and safety of vehicles over time.
Tribology testing systems demonstrate the outcomes of wear and friction. In a similar way, 3D optical microscopes can offer a deeper understanding of the complex causes and impacts of friction and wear. Integrating advanced 3D surface optical metrology with high-fidelity imaging of the material surfaces offers more opportunities for defect or feature characterization of functional surfaces.
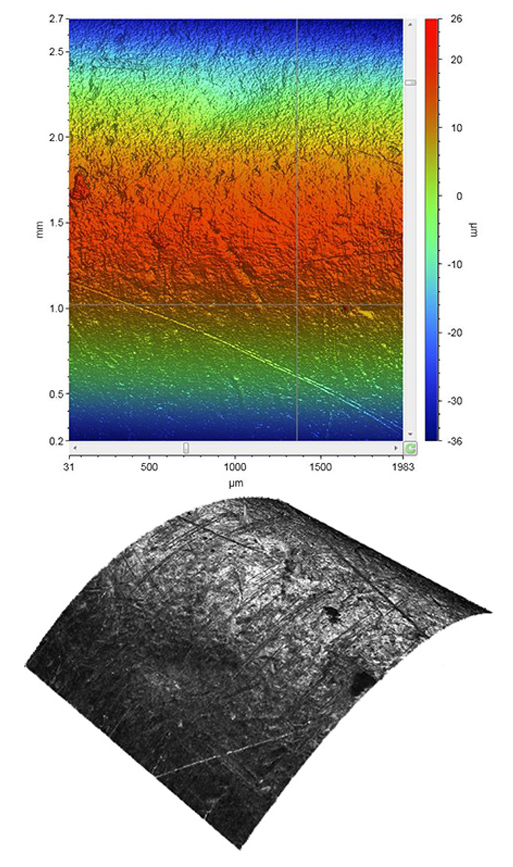
Figure 2. Metal cylinder color-coded height map (top) and high-fidelity, through-focus grayscale image (bottom). Image Credit: Bruker Nano Surfaces.
Precise metrology data combined with vivid images offers users the full surface characterization story. Through this integration of quantitative measurement, testing, and visualization of surfaces, both automotive manufacturers and their suppliers allow compliance with increasingly rigorous regulations and standards, while ensuring that their clients receive products with the best performance.

This information has been sourced, reviewed and adapted from materials provided by Bruker Nano Surfaces.
For more information on this source, please visit Bruker Nano Surfaces.