The characterization of semiconductor spin qubits with radiofrequency (RF) reflectometry offers the advantage of speed over low-frequency conductance measurements. This article discusses the measurements of Josip Kukucka and his colleagues working at the Nanoelectronics group at IST Austria.
Further, this article explains how to perform RF reflectometry using the UHFLI Lock-in Amplifier to measure the Coulomb blockade diamonds of a semiconductor nanostructure. Due to the large range of frequency and measurement bandwidth of the UHFLI, this technique is accomplished using an all-digital approach that supports multi-frequency operation. This enables the possibility of using fast readout techniques which can exploit coupling to multiple gate electrodes.
Coulomb Blockade
As early as 1998, Loss and DiVincenzo had proposed the use of the spin of confined electrons to realize a spin qubit [1]. Such spin qubits can be hosted in quantum dots (QDs) – which are nothing but semiconductor nanostructures. These can be typically studied at millikelvin temperatures.
Coupling a QD to source and drain electrodes allows for Zurich Instruments to address the electronic properties of a QD by low-temperature electrical transport measurements, making use of the phenomenon called Coulomb blockade, which is illustrated in Figure 1. At low temperatures, the current through the QD is generally blocked, due to the fact that no electrochemical potential of the QD (which features as the dashed lines in Figure 1) remains inside the energy window, as defined by the source-drain voltage VSD = (μd – μs)/e.
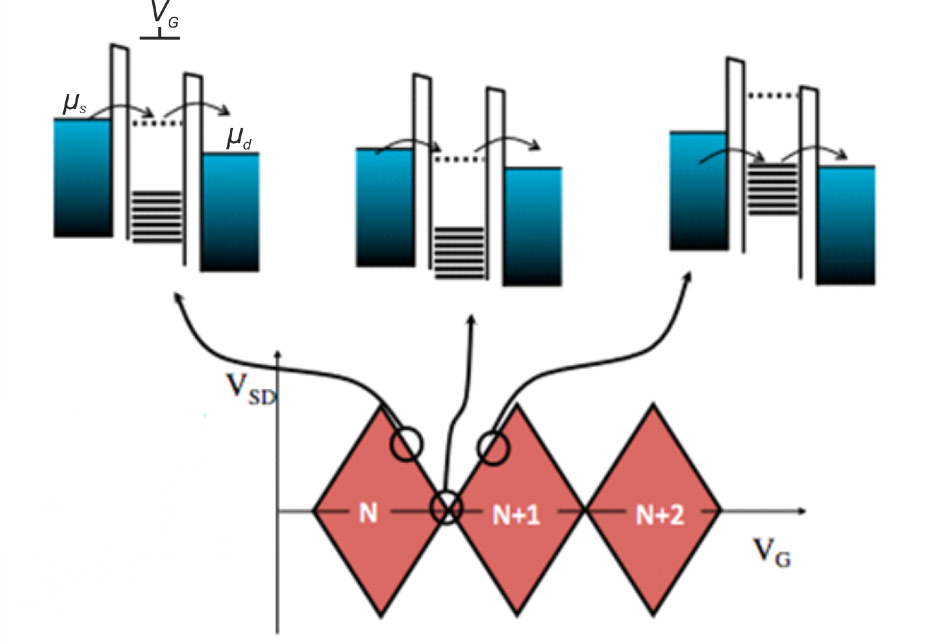
Figure 1. Schematic representation of a charge stability measurement (diamond plot) of a QD. The upper part explains the alignment of electrochemical potentials while the lower part shows the corresponding DC current measurement. Within the diamonds (red) electron transport is blocked and the electron number inside the QD remains constant. Image Credit: Zurich Instruments
The transport of electrons can be activated by limiting the electrochemical potential of a QD level in between μs and μd. This can be achieved either by changing the gate voltage VG or by making the source-drain bias window VSD larger. Thus, sweeping VG versus VSD allows maping of a QD stability diagram. As shown in Figure 1, this results in a series of diamond-shaped regions, i.e. the Coulomb diamonds, inside which the electron number on the QD remains constant. More information about spin qubits can be found in [2].
Measurement Techniques
The direct current measurement is a standard measurement method to obtain such a diamond plot. This method is prone to low-frequency 1/f noise and the bandwidth is small due to the strong low-pass filtering required to achieve a low effective temperature of the electrons in the sample.
On the other hand, a different measurement technique that has emerged in recent years is the so-called RF reflectometry technique. The idea behind RF reflectometry is to sense indirectly the impedance change of a QD. This is achieved through the close monitoring of the amplitude and/or the phase of an RF wave reflected from a QD. Such a method is usually implemented with the help of high-frequency lock-in techniques and is not prone to 1/f and other types of low-frequency noise, due to a high frequency operation. Thus, this enables higher bandwidth, which consequently results in higher measurement speed.
The RF reflectometry technique relies on the principle of electromagnetic wave propagation. This principle states that if a wave travels in a medium with characteristic impedance Z0 (e.g. coaxial cable) and it encounters a change of impedance from Z0 to Z (e.g. at the end of coaxial cable), a portion of the wave will be reflected back according to the expression Ar = Ain x Γ, where
Γ=(Z-Z0)/(Z+Z0) represents the reflection coefficient, Ar is the amplitude of the reflected wave, and Ain stands for the amplitude of the incoming wave.
The use of this principle on a resonant circuit consisting of a tank circuit connected to a QD (Figure 2) produces information about the QD through the measurement of the amplitude of the reflected wave. It is important to choose the elements of the resonant circuit, the inductance L and the capacitance C in such a way that, at the resonant frequency f0=1/(2¶LC) of the circuit, it is possible to achieve the matching condition.
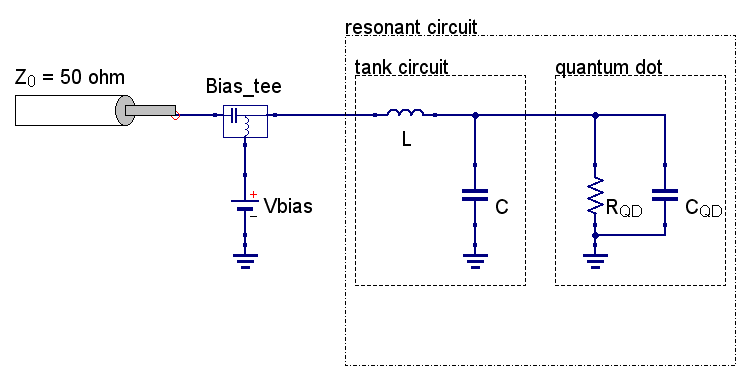
Figure 2. Basic principle of ohmic reflectometry. The resonant circuit consists of an LC tank circuit (matching circuit) connected to one of the leads of the QD. The QD is represented as a parallel combination of a resistance RQD and a capacitance CQD. Image Credit: Zurich Instruments
The matching condition results in the transformation of a typically large QD resistance (~100 kΩ) to the resonant circuit impedance of Z ≈ Z0 = 50 ohm. Consequently, the wave reflection coefficient Γ is then minimized. In such a scenario, the sensitivity is maximized [3], and small changes in the QD impedance result in an observable change in the reflected wave amplitude.
Measurement Setup and Results
Fabricated at the LETI facilities in Grenoble, France, the sample comprises a SiGe/Si p-FET transistor [4]. At low temperatures, it functions like a QD, and is mounted on the printed circuit board (PCB) sample holder (Figure 3). This sample holder is then mounted to the mixing chamber plate of the dilution refrigerator having a base temperature of ∼30 mK. Meanwhile, the LC tank circuit is soldered directly on the PCB. In this setup, both DC and RF signals are routed to the PCB bonding pads, and the wedge wire bonding technique is used to connect this to the QD sample.
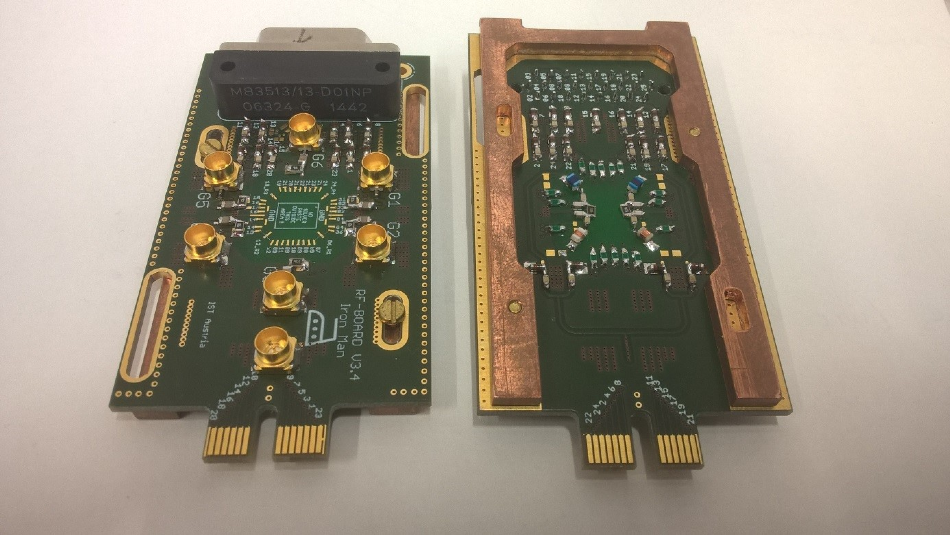
Figure 3. The PCB sample holder top view (left) and bottom view (right). Image Credit: Zurich Instruments
A single PCB carries four tank circuits with different inductors, and this enables measurements at four different resonant frequencies. For the determination of resonant frequencies, what is needed is the measurement of the reflection coefficient of the resonant circuits as a function of frequency.
As seen in Figure 4, the electrical measurement setup includes a directional coupler which enables the reflection coefficient measurement with the UHFLI. To simplify the representation, the DC part of the setup is not depicted.
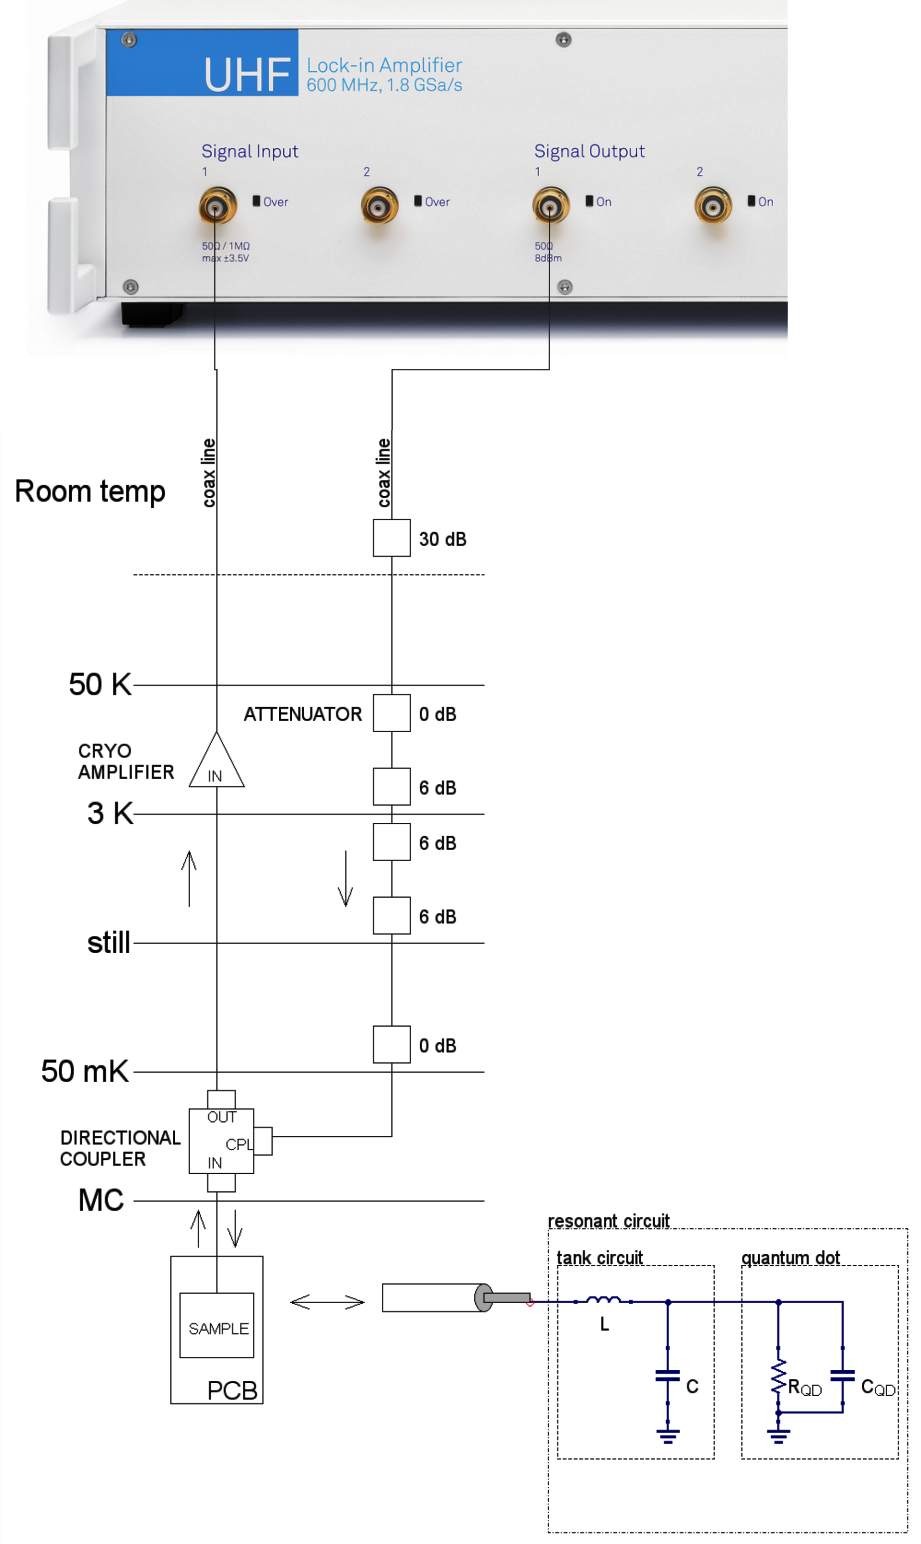
Figure 4. Schematic representation of the RF part of the measurement setup. The excitation signal is sent from the UHFLI’s Signal Output to the cryostat with the different temperature stages indicated as horizontal lines. Attenuators (including 0 dB) are used for thermalization. Via a directional coupler the signal is sent towards the sample mounted to the mixing chamber (MC) plate. The reflected signal passes through the directional coupler and gets amplified with a low-noise cryogenic amplifier. The amplified signal is fed into the UHFLI’s Signal Input where it is demodulated and low-pass filtered. This measurement signal is then sent to the PC. Image Credit: Zurich Instruments
With the use of one of the UHFLI oscillators, the sine signal generated was sent down the dilution refrigerator to the directional coupler coupled (CPL) port. This was then swept using the LabOne Sweeper. To suppress the noise, the reflection signal was read out by the UHFLI’s input, demodulated to DC and thereby filtered. Figure 5 shows the measurement which reveals four resonances that correspond to the four LC tank circuits using different inductors.
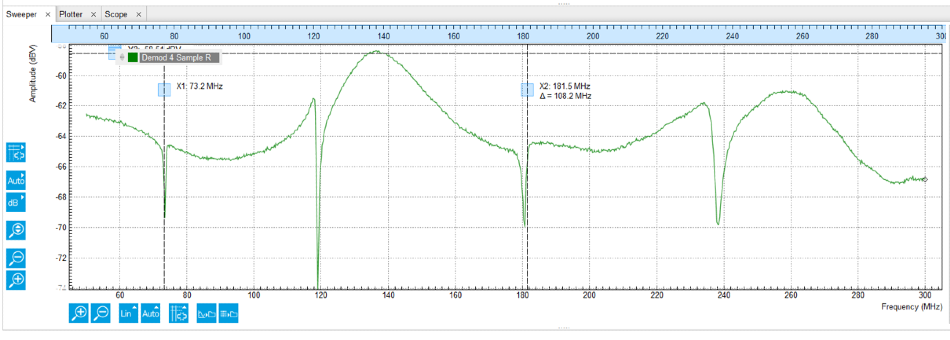
Figure 5. Reflection coefficient as a function of frequency measured with the LabOne Sweeper. Image Credit: Zurich Instruments
For recording the diamond plot of a QD shown in Figure 6, the excitation sine signal frequency was set to the resonance frequency of the tank circuit to which the QD was connected. Figure 2 depicts the electrical equivalent schematic of this configuration.
In order to avoid heating up the electrons, the amplitude of the excitation signal reaching the QD needs to be very small. A 30 dB attenuator was added at the output of the UHFLI, to achieve this as well as a better signal-to-noise ratio on the output. Further, to achieve a reasonably good signal-to-noise ratio, the UHFLI low-pass filter bandwidth of 1 kHz was selected. The gate and source-drain bias voltages were swept during the measurement f the reflection amplitude.
Both these DC voltages were generated using custom-made DAC modules from TU Delft. The UHFLI parameters for recording the diamond plot in Figure 6 are displayed in the graphical lock-in tab display in Figure 7.
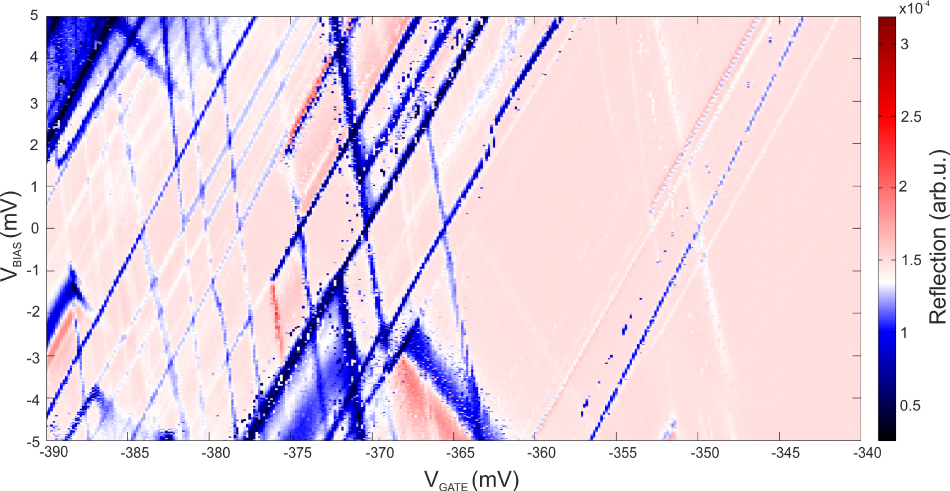
Figure 6. Diamond plot of a QD recorded with the UHFLI, measured by Lada Vukušic. For each value VGATE of the gate voltage , the source-drain bias voltage VBIAS was ramped from -5 to 5 mV with a step size of 20 μV. The step size of the gate voltage was 150 μV. After setting each DC point and waiting for three low pass filter time constants, 1000 data samples of the demodulated reflected signal from demodulator 4 were collected to a PC and averaged. Every time an electrochemical potential in the QD aligns with μS or μD (Figure 1), the current through the QD changes, and as a consequence also its impedance. This impedance change is then observed as a change of the reflection coefficient (white and blue lines in the figure). Image Credit: Zurich Instruments
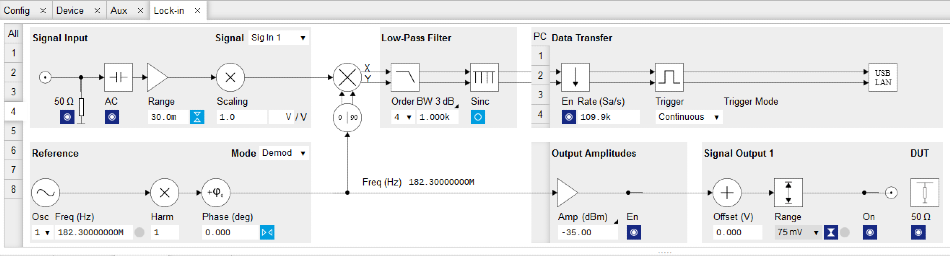
Figure 7. LabOne user interface to the UHFLI Lock-in Amplifier with the settings used for the QD diamond plot reflectometry measurement shown in Figure 6. Image Credit: Zurich Instruments
Moving towards multiplexed gate reflectometry
The focus above was on the ohmic reflectometry technique, where one of the metallic leads of the QD is connected to the LC tank circuit. Another promising option could be the use of gate reflectometry, when moving towards more complex devices with many gates (for example double QDs).
Rather than to the source or drain contact, in gate reflectometry the LC tank circuit is connected to a gate electrode. To understand what is happening in the complex QD devices, it is beneficial to be able to read out all gates at the same time, using the frequency multiplexing principle. Such a scenario requires generating and demodulating multiple carrier signals simultaneously, a feature that can be achieved using the UHF-MF Multi-frequency option.
Connecting an off the chip tank circuit to the gate electrode allowed a single shot dispersive readout of a spin state in silicon double quantum dots [5,6,7] and hole spin qubit measurements in CMOS devices [8]. In addition Josephson parametric amplification has boosted the fidelity, estimated to 99.7% in 1us integration time [9]. The gate reflectometry spin state readout is thus nowadays comparable to the ohmic reflectometry performed on proximal charge sensors [10].
References
- D. Loss, D.P. DiVincenzo, Physical Review A 57, 120 (1998).
- R. Hanson et al., Reviews of Modern Physics 79, 1217 (2007).
- N. Ares et al., Physical Review Applied 5, 034011 (2016).
- S. Barraud et al., IEEE TRANSACTIONS ON ELECTRON DEVICES 61, 953 (2014).
- A. West et al., Nature nanotechnology 14, 437 (2019).
- P. Pakkiam et al., Phys. Rev. X 8, 041032 (2018).
- M. Urdampilleta et al., Nature Nanotechnology 14, 737 (2019).
- A. Crippa et al., Nature Comm. 10 2776 (2019).
- S.Schaal et al., Phys. Rev. Lett. 124 067701 (2020).
- D. Keith et al., Phys. Rev. X 9, 041003 (2019).
Acknowledgments
- Produced from materials originally authored by Bruno Küng from Zurich Instruments.

This information has been sourced, reviewed and adapted from materials provided by Zurich Instruments.
For more information on this source, please visit Zurich Instruments.