Omega Optical has recently changed its multispectral fluorescence detection system to flow-cytometry.
The hardware was initially produced for confocal applications and consists of pulsed laser excitation with a serial arrangement of reflecting fiber tips, separated by fiber delay lines.
The fiber array’s proximal tip acts as the confocal pinhole. As each fiber tip in the series reflects a sequentially longer wavelength into the PMT detector, a time-indexed spectrum is produced. Up to 10 spectral bins are determined by the wavelength intervals between the reflecting fiber tips.
This structure enables the acquisition of a multispectral dataset in 2.5 microseconds using one PMT, which can be spectrally unmixed or processed more.
A sequence of excitation lasers with fiber arrays and matched detectors can be placed in the flow path to maximize the number of potential labels even further.
The fiber-based method can be used to discern forward and side scattering in the cells simultaneously. It is estimated that as many as 80,000 cells can be organized each second in applications that are non-imaging. Utilizing Omega’s current hardware, the imaging of 400 cells per second should be attainable.
Switching to a resonant-scanning mirror instead of the galvo mirror used at present could enhance the rate of imaging even more.
The spatial resolution can be changed through focusing and defocusing. This article will present the initial results of both sorting and imaging channels to show how this technique will produce compact and lightweight flow systems with multiple channels.
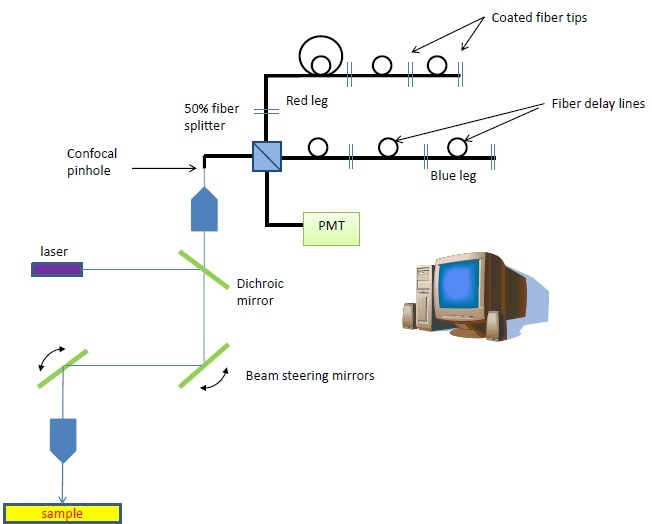
Figure 1. The fiber-based multispectral confocal microscope was developed with an SBIR grant from the NIH/NCI. The unique detection scheme is composed of 2 serial arrays of coated fiber tips that reflect wavelength bins to the detector at sequential timepoints, building a spectrum of each pixel within 2.5 μs.
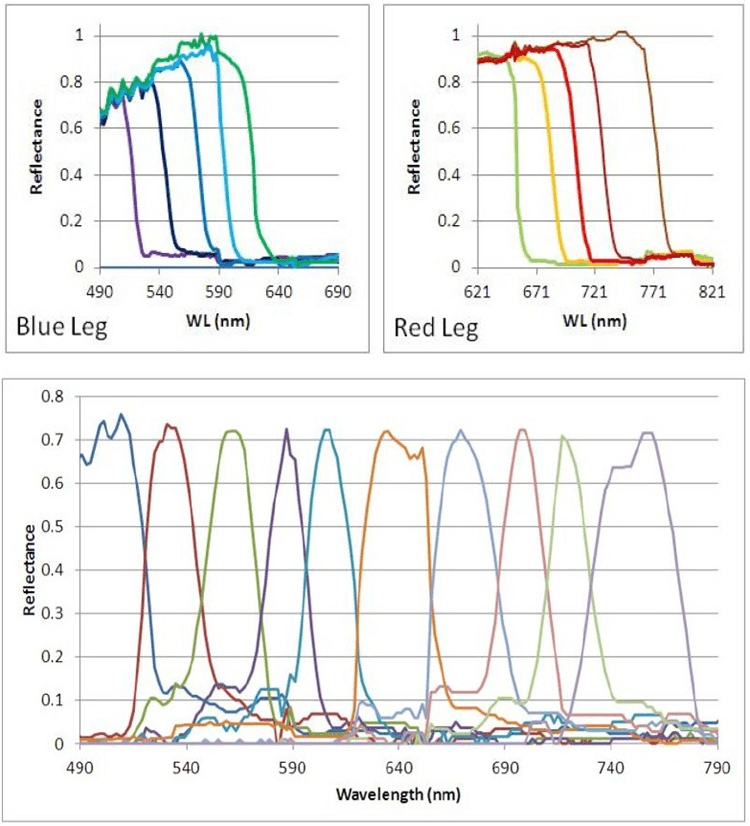
Figure 2. Top, spectral response of the individual fiber tips. The blue wavelengths exhibit fiber loss. Bottom- Scaled spectral response of the entire fiber array. The light reaching the PMT is a time-indexed series of band-passed light centered at progressively longer wavelengths.
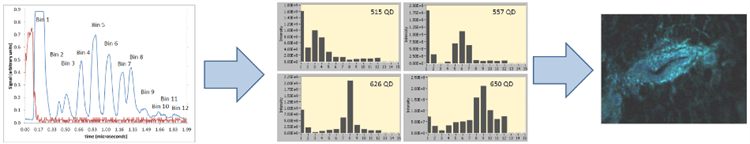
Figure 3. The data acquisition and display process
The red pulse signifies ‘go’ and is communicated to the laser, which delivers a 100 ns laser pulse to the sample. The wavelength bins return to the detector sequentially during the process. The speed of the raw data is detector-limited.
The first bin is the rejection of ‘blue leg’ light from the red leg. The second is empty, whereas bins 3 to 12 represent the wavelength bins outlined above. To enable recovery between the pulses and ensure the detector provides the optimal response, the delay lines are arranged at a distance from each other.
The presented data is processed to remove minute amounts of cross-talk in the middle of the channels and to make up for the sequential fiber arrays’ non-centrosymmetric state.
These are histogram examples acquired from the GUI, which portray the emission spectra of several quantum dots excited at 488 nm. Each of the bins are retrieved and processed for each pixel.
The data can be visualized in many different ways. The two-in-one fiber combiner in real-time can show three channels simultaneously (RGB and above), spectral angle mapping, multichannel math, monochrome single channel, and monochrome (maximum pixel intensity).
Preliminary Results
The system was designed for the purpose of imaging, so its present capabilities were the starting point. Single-point scanning was utilized to determine the system’s speed limitations as independent control of the mirrors was unavailable at that time.
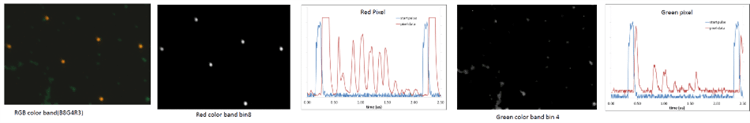
Figure 4. Illustrates mixed beads and the raw data traces that correspond to the red and green pixels from the oscilloscope. Red pixels were 4 μm, and green beads were 2 μm in diameter. These were colorized in real-time by assigning RGB colors to bins x,y,z, respectively.
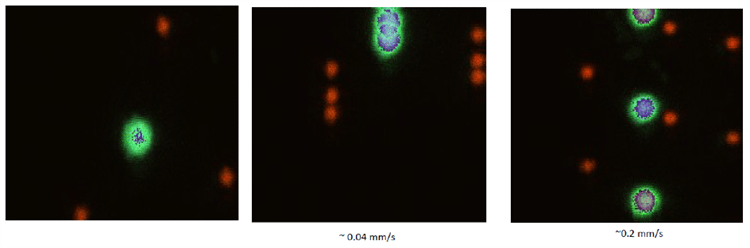
Figure 5. Overlay of sequential images while moving the stage. Images are displayed with RGB. We manually moved the stage while acquiring sequential images to illustrate the speed of the system. Note that the shapes are not perturbed by the motion at these speeds.
Methods - Single Point Measurements
100 mm ID square quartz tubing or pulled round glass tubing was utilized to replicate the flow cytometer’s detection chamber.
These were epoxied into syringe needles and onto the slide of a microscope to maintain stability during the investigations. Manual compression was utilized on the syringes to trigger the flow of beads inside of the tubing.
The beads within the tubing were the main focus of the system. After this, the scanning mirrors were centered and disabled. Direct oscilloscope output was employed to avoid the image processing function of the software to determine the speed of the system.
Oscilloscope output (TIFF) was analyzed for FWHM of the time responses using ImageJ to measure the linear speed of the beads in the system.
The initial investigations employed 6 mm diameter 6-color Spherotech beads for an even speed prediction and signal. Experiments were additionally performed on a mixture of 2 mm green, 4 mm red, and 6 mm Spherotech beads.
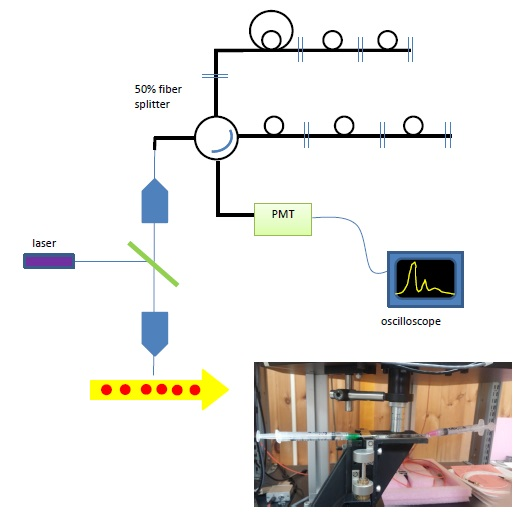
Figure 6. (top) Schematic of Single-point measurements, (inset) photo of the flow cell installed on the stage.
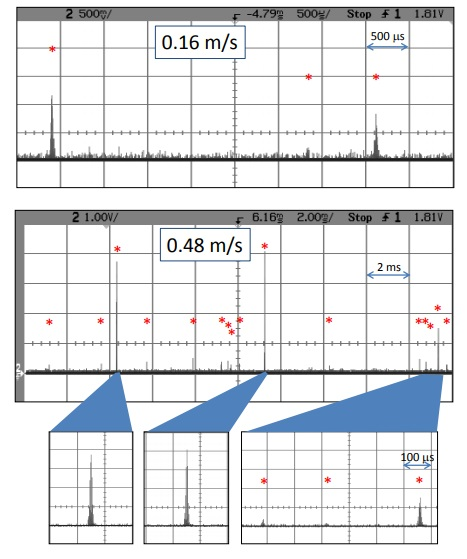
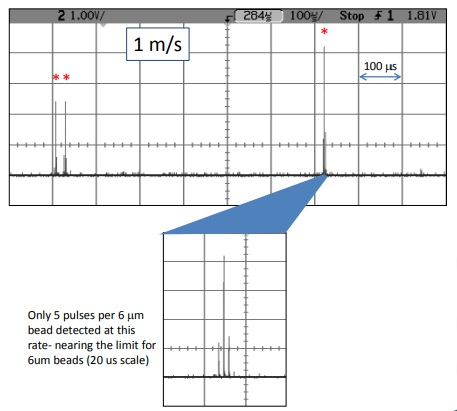
Figure 7. These are 6 mm Spherotech beads that exhibit a variety of intensity levels. The theoretical limit for 6 mm beads is 2.4 m/s, which would give one pulse per particle. Electronic noise does not show up in all bins, but rather as random spikes, allowing for filtering. Image Credit: Omega Optical, Inc.
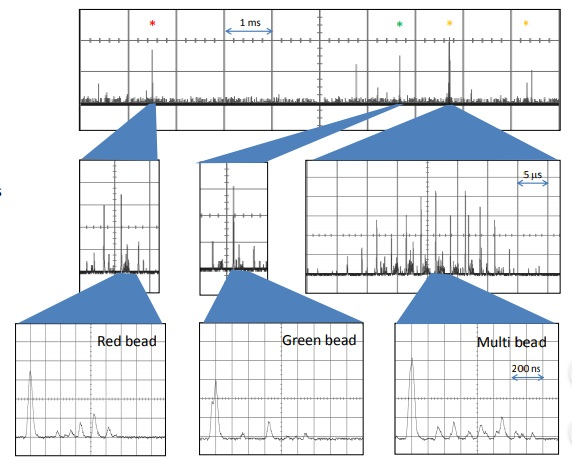
Figure 8. Single-point detection of mixed beads flow rate ~ 0.5 m/s A mixture of beads with different colors and sizes 1 μm green beads 2 μm red beads 6 μm multi-colored beads. The system can easily determine the bead type based on size and spectral composition.
Conclusions and Future Directions
The experiments demonstrated that a 10-channel, single-point fluorescence flow-cytometer detection system can achieve linear flow rates of 1 m/s.
The speed of the system can be optimized depending on the particle size. This arrangement can be modified to incorporate front and side-scattering capabilities, as shown in Figure 9.
With small modifications to the system, it is predicted that 10-color imaging detection will also be attainable at rates up to 400 cells per second (6 μm diameter). For this to occur, the mirror control software would need to be altered, as demonstrated in Figure 10.
Every perspective would require updates of the user interface to be optimized for flow. Collaborations are welcome in the progressing development of this system.
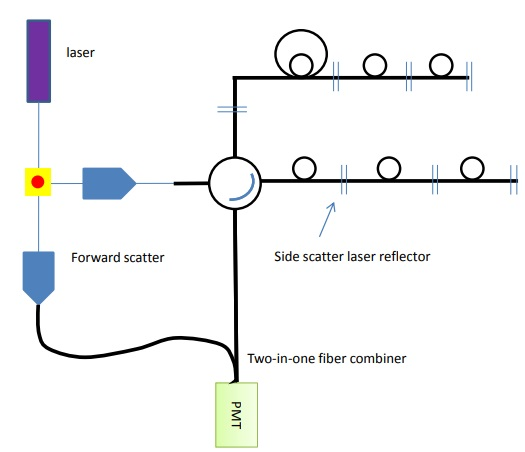
Figure 9. Forward and side scatter channels can be added to the detection array by adding another reflector and a fiber combiner.
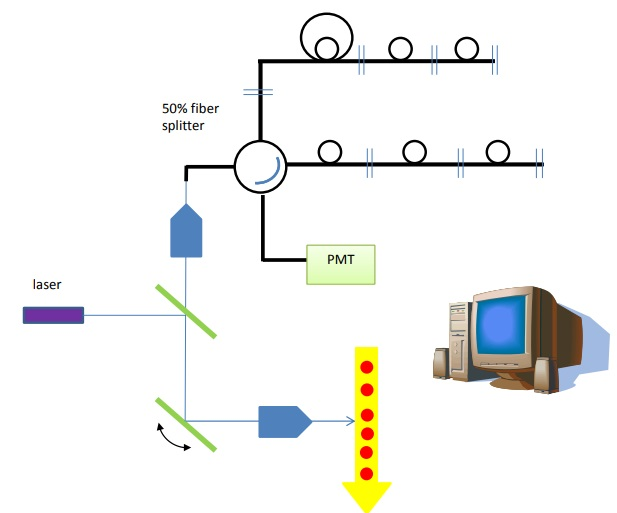
Figure 10. In imaging mode, a single x-mirror can be used to raster across the cells while detecting in the back-scatter direction.
References and Further Reading
- Carver, G.E., Locknar, S.A., Morrison, W.A., Ramanujan, V.K. and Farkas, D.L. High-speed multispectral confocal biomedical imaging", J. Biomed. Opt. 19(3), 036016 (Mar 21, 2014).; http://dx.doi.org/10.1117/1.JBO.19.3.036016
- Carver, G.E., Chanda, S.K., Morrison, W.A., Locknar, S.A., and Johnson, R.L. System for Multispectral Imaging of Fluorescence US Patent 9,155,474 (Oct 13, 2015)
Acknowledgments
Harika Vengaladasu for help in data collection, analysis and poster preparation. The prototype confocal instrument was developed with funding from the National Cancer Institute through the NIH (SBIR Ph. II 5R44CA124036-03).
Produced from materials originally authored by Sarah Locknar, John Barton, and Gary Carver from Omega Optical, Inc.

This information has been sourced, reviewed and adapted from materials provided by Omega Optical, Inc.
For more information on this source, please visit Omega Optical, Inc.