Key Issues
- Optimization of gas scrubber operation
- Quantification of CO2 loadings
- In-line monitoring of liquid phase during regeneration and absorption
Introduction
Absorption of gas components such as hydrogen sulfide (H2S) and carbon dioxide (CO2) is a highly regarded treatment option for cleaning a range of ‘acid gases’. Gas cleaning through the use of amines is possible because of an intricate relationship between physical parameters and chemical reactions.
Amine scrubbers are commonly employed within numerous industrial areas to clean these specific components from synthesis gas and off-gas. Amine scrubber-based approaches are also found in the preparation of special gases such as landfill gas, sewage gas, methane and biogas.
Current investigations are concentrated on detergent mixtures of methyldiethanolamin (MDEA), mono or ethanol amine (MEA), 2-(2-Aminoethoxy)ethanol (Diglycolamine® DGA) and water. These detergent mixtures are already in use in commercial settings for the absorption of carbon dioxide and hydrogen sulfide from special gas flows.
Raman spectroscopy is a popular means of chemical reaction monitoring because of the Raman spectrum’s high information content. Utilizing compact Raman systems and fiber optic probes enables the full potential of laboratory Raman spectroscopy to be employed in industrial manufacturing settings across a diverse array of industries.
In this particular study, a Raman Rxn Systems™ Raman analyzer from Kaiser Optical Systems, Inc., (Kaiser) was investigated. The study’s primary goal was to ascertain whether or not Raman spectroscopy could be employed to directly monitor chemical compositions on-line, thus allowing quantification of the CO2 loadings in the amine scrubber.
Experiment
This experiment was conducted in 2007, making use of the amine scrubber at the Institut für Energie und Umwelttechnik e.V. in Germany.1 The test facility allowed for both the investigation of absorption and desorption in a closed cycle, with absorption pressure being tested up to 26 bar.
The absorption column had a height of 4.7 m and an inside diameter of 0.312 m, while the desorption column had a height of 5.76 m and an inside diameter of 0.316 m. These were filled with modern, structured packages provided by Sulzer Chemtec.1
A Kaiser Raman analyzer fitted with a 785 nm laser and a fiber coupled Raman probe employing immersion sampling was used for these measurements. Raman spectra were acquired within a few seconds, utilizing around 180 mW of laser power.
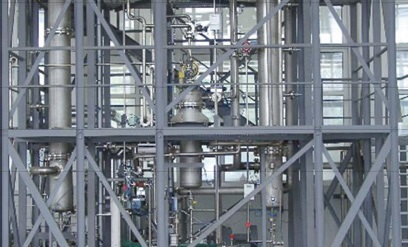
Figure 1. Gas scrubber facility IUTA. Image Credit: Kaiser Optical Systems, Inc.
Results
A number of changes in the Raman spectra can be observed throughout the absorption process.2
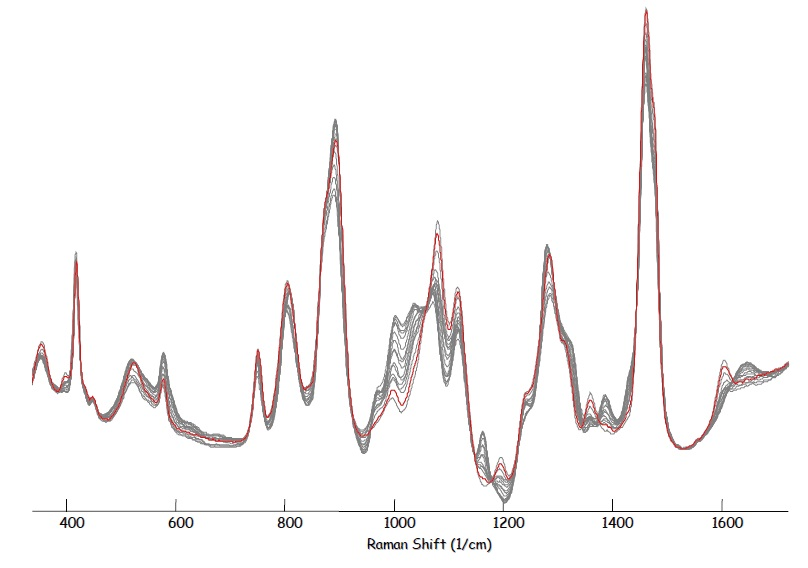
Figure 2. DGA - Raman spectra for absorption process. Image Credit: Kaiser Optical Systems, Inc.
The results show amine specific band at 1610 cm-1 which diminishes over time, revealing the consumption of DGA. Meanwhile, a band at 1021 cm-1 reveals formation of the bicarbonate (HCO3-) species.
In order to facilitate process monitoring, CO2 was bubbled through a solution that contained 30% DGA in water at a temperature of 25 °C. Raman spectra were acquired every 30 seconds, with bands for loaded and unloaded CO2 containing solution being monitored over time.
CO2 gas was stopped after 30 minutes had elapsed. Next, the solution was heated to 90 °C prompting the process solution to regenerate. Figure 3 illustrates the absorption – desorption process of DGA – the process here was monitored using in-line Raman spectroscopy.
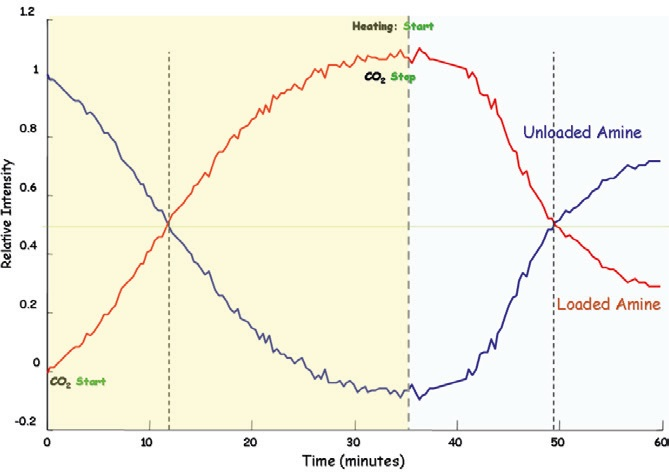
Figure 3. Absorption-desorption process monitoring. Image Credit: Kaiser Optical Systems, Inc.
Calibration
To enable calibration, samples of different CO2 loadings in 15%, 30% MEA and 30% DGA at 25 °C were created via an apparatus which was specially built at the University of Duisburg.2 The absorber was fitted with a vacuum pump and N2 gas inlet, designed for the evacuation of air and the drying of the vessel.
Once the absorber had been filled with the required amine solution, a mass flow controller (MFC) facilitated the addition of precisely defined quantities of CO2 gas into the stirred solution.
Twelve sample sets of different CO2 loadings in both MEA and DGA were prepared via this approach. Following equilibrium, each concentration was measured 20 times with the Raman equipment discussed earlier.
The Raman spectral information was used to construct a PLS chemical model, through the use of the multivariate data analysis package Grams PLS/IQ. Once the initial model was constructed, it was then validated with a set of 15 validation samples.
Figure 4 shows a calibration plot for data from CO2 loadings in MEA at 25 °C. This data is highly repeatable, confirming a calibration with R2=0.99987. A corresponding validation set was able to confirm the prediction model’s accuracy.
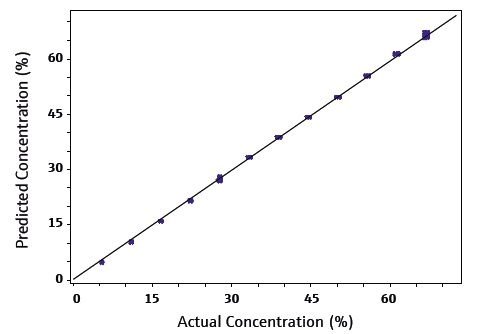
Figure 4. MEA Calibration curve for CO2 loadings at 25 °C. Image Credit: Kaiser Optical Systems, Inc.
Conclusion
Gas scrubbing processes that use CO2 and various aqueous amine solutions may be successfully monitored using Raman spectroscopy.
Loaded and regenerated liquid phases may be monitored via Raman immersion optics, directly in-line.
Here, a quantitative PLS model was established for various CO2 loadings, with this model being employed for quantitative in-line monitoring of CO2 loading.
References
- Dipl.-Ing. Monika Vogt, Institut für Energie- und Umwelttechnik e.V, Bliersheimerstraße 60, 47229 Duisburg, Germany - http://www.iuta.de/
- Dr. Christoph Pasel, University of Duisburg-Essen, Fakultät für Ingenieurswissenschaften, Abteilung Maschinenbau, Abfalltechnik, Lotharstraße 1, MD 130, 47057 Duisburg, Germany.
This information has been sourced, reviewed and adapted from materials provided by Kaiser Optical Systems, Inc..
For more information on this source, please visit Kaiser Optical Systems, Inc..