Raman spectroscopy is a non-destructive analysis technique that is outstanding for measuring the frequencies of chemical bond vibrations.
As these occur at particular energies relying on the exact chemical environment around the bond, a survey of varying frequencies can be used to ‘fingerprint’ distinct chemical compounds, even for complex chemical species, including monoclonal antibodies.
Raman spectroscopy can be utilized to quantify the levels of impurities for confirmation of the production of the desired products. One of the major challenges in the preparation of monoclonal antibodies is usually when chromatography is used in the purification process.
Inefficiencies and complexities in this phase are often lead expensive. This is why, in part, therapies with monoclonal antibodies cost more.2
Purification Problems
Good control over chromatographic separation processes is necessary in order to obtain maximum product yields with limited contamination. This means that the chromatographic peaks related to the product elution are sharp and distanced from all other compounds.
For the scaling up of synthesis to industrial levels, reducing the overall time taken for column separation as much as possible is key, as is establishing approaches and procedures where the synthesis and purification can be performed in a continuous system.3
One of the properties that is duly monitored as part of process enhancement is the breakthrough curve of the column.
Breakthrough curves determine when a column is totally saturated or when the amount of target input compound (for instance, the unpurified monoclonal antibody) equals the amount of antibody exiting the column.
This is the moment when additional material added to the column would basically result in product losses but also where the column is being utilized most efficiently. In situ monitoring of the breakthrough curves is vital for the optimization of chromatographic antibody purification.
The progressive design of systems that bear such capacities is the subject of ongoing research: for instance, researchers at the Institute for Chemical and Bioengineering in Zurich used Raman spectroscopy in conjunction with physical modeling to develop sample delivery systems that monitor monoclonal antibody breakthrough curves on a chromatographic column.4
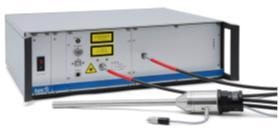
Multispec Raman System. Image Credit: tec5USA Inc
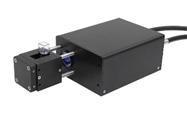
tecRaman Probe 785 Cuvette. Image Credit: tec5USA Inc
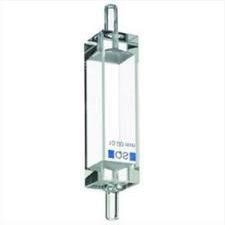
Hellma Flow-through Cuvette. Image Credit: tec5USA Inc
High Performance Raman Spectroscopy
The Raman signals can be quite weak, which presents a challenge when using Raman spectroscopy for sample analysis.
The researchers in Zurich managed to get around this by combining the Raman analyzer with an extended Kalman filter approach – an algorithm that estimates statistical quantities by merging multiple measurements taken over a period of time.
Such analyses are facilitated by the next-generation of high performance Raman systems, including the MultiSpec Raman system (versatile R&D system) and CompactSpec II Process Raman spectrometer developed for high risk locations by tec5USA. a global leader in spectroscopy.5&6
The MultiSpec used 600 μm fibers for high optical throughput. Use of precise and premium optics is the key to accurate Raman spectroscopy – the MultiSpec system utilizes a temperature-stabilized 785 nm laser in combination with VPH transmission gratings.
This system limits straylight, allows for exceptional spatial uniformity and has very low, transmitted wavefront errors.
Powered by 1 MP/s 16 bit AD conversion the tec5USA hardware enables rapid data acquisition. Real-time data processing can be used to personalize control procedures or to conduct extensive averaging and smoothing to improve measurement accuracy.
The overall result is a system with the capacity to monitor monitoring antibody breakthrough curves in-situ with great accuracy while allowing the optimization of chromatographic antibody purification processes.
tec5USA’s spectroscopy systems haves numerous special features which enable this kind of analysis. Their inline spectrometers are adaptable and scalable, providing a range of enclosures, electronics and probes to accommodate application.
Their spectrometers are also exceptionally robust and are appropriate for use in extreme temperatures and pressure conditions and other harsh industrial environments. tec5USA systems come equipped with the latest generation of analysis and data acquisition software, MultiSpec Pro II.
tec5USA Spectroscopy Solutions
As well as antibody measurements and optimization solutions, tec5USA can provide a wide range of various products and expertise in Raman, UV-VIS, NIR and LIBS spectroscopies. This includes high speed, mobile spectroscopy devices and several solutions for industrial process control.
Process evaluation and custom solutions are also possible, drawing on tec5USA’s vast experience as both OEM and high grade industrial system designers and manufacturers.
Most biotech firms working in vaccine and antibody development require non-destructive, rapid sample identification that is dependable, so no vital samples are wasted.
Already, Raman spectroscopy is a frequently used process analytical technology for such applications but, for a large number of labs, spectrometers must be integrated with existing workflows to avoid expensive redesign and upgrades.
This is precisely the kind of in-situ or inline measurement tec5USA’s systems are made for, as well as offering accelerated routes to acquire crucial data on the state of reactions.
Process automation ideally demands non-invasive, accurate measurements in an online format; tec5USA’s systems have been used successfully across a range of applications, including reaction monitoring in microchannels and bioprocess monitoring of cell cultivations.
One of the major advantages of tec5USA’s systems is the high stability of the Raman setups that make it possible to accurately identify the smallest changes in concentration, whether immersion probes are necessary or just flow cells for passing the laser beam through the sample.
With the possibility to customize the configurations of spectrophotometer devices and a wide-ranging portfolio covering many aspects of spectroscopy, tec5USA is an optimal choice for spectroscopy for any application.7
References
- BCC Research (2020) Raman Spectroscopy Markets, https://www.bccresearch.com/market-research/instrumentation-and-sensors/raman-spectroscopy-markets-report-ias110a.html, accessed 8 May 2020
- Liu, J. K. H. (2014). The history of monoclonal antibody development - Progress, remaining challenges and future innovations. Annals of Medicine and Surgery, 3(4), 113–116. https://doi.org/10.1016/j.amsu.2014.09.001
- Kelley, B. (2007). Very large-scale monoclonal antibody purification: The case for conventional unit operations. Biotechnology Progress, 23(5), 995–1008. https://doi.org/10.1021/bp070117s
- Feidl, F., Garbellini, S., Luna, M. F., Vogg, S., Souquet, J., Broly, H., … Butté, A. (2019). Combining mechanistic modeling and raman spectroscopy for monitoring antibody chromatographic purification. Processes, 7(10). https://doi.org/10.3390/pr7100683
- tec5USA (2020) Raman Spectroscopy, https://www.tec5usa.com/, accessed 8 May 2020
- tec5 (2020) Multi-Spec Raman, https://www.tec5usa.com/, accessed 8 May 2020
- tec5USA (2020) Products, https://www.tec5.com/en/products, accessed 8 May 2020

This information has been sourced, reviewed and adapted from materials provided by tec5USA Inc.
For more information on this source, please visit tec5USA Inc.