The US EPA has cataloged 14,735 PFAS species as manufactured compounds, precursors, and degradation products.1 This makes their systematic and thorough monitoring particularly challenging. This study presents an innovative, non-targeted, suspect methodology for a comprehensive PFAS analysis, integrating trapped ion mobility spectrometry (TIMS) with LC-HRMS/MS data.
PFAS: Persistent Threats to Health and Environment
Per- and polyfluoroalkyl substances (PFAS) have become prominent environmental and public health concerns. Defined by the OECD in 2020 as “fluorinated substances that contain at least one fully fluorinated methyl or methylene carbon atom (without any H/Cl/Br/I atom attached to it)”, PFAS have been produced and utilized since the 1940s. Due to their resistance to heat, water, and grease, these substances have played essential roles in everyday products.
PFAS are often referred to as “forever chemicals” because of their persistent, bioaccumulative, and toxic (PBT) characteristics, as well as their widespread presence in the environment and living organisms.
While the associated health risks are not entirely understood for all PFAS, available evidence indicates that exposure may adversely affect reproduction and development, liver, kidneys, and the immune system, and may contribute to tumor formation.
Contamination by PFAS is now commonly observed in surface and groundwater, originating from sources such as landfills, agrochemical usage, industrial processes, firefighting operations, and other activities.
Regulating PFAS: Detection and Evolving Limits
PFAS is routinely quantified through liquid chromatography (HPLC) coupled to triple quadrupole (TQ) mass spectrometers. Multiple regulations and legal thresholds for PFAS concentrations were introduced in recent years, and these limits continue to evolve.
The US EPA has released the final National Primary Drinking Water Regulation (NPDWR) covering six PFAS compounds. Health advisories are currently in place for these compounds: PFOA and PFOS (4 ng/L interim), PFHxS, PFNA, and HFPO-DA (10 ng/L interim). The EU Drinking Water Directive 2020/2184 includes a requirement to satisfy a limit of 100 ng/L for a list of 20 different PFAS or 500 ng/L for all PFAS.
Challenges in Comprehensive PFAS Monitoring
In 2023, five national authorities within the European Union (Germany, Denmark, the Netherlands, Norway, and Sweden) submitted a proposal for the total restriction on the production, marketing, and use of PFAS. Monitoring this restriction means the requirement for the detection and identification of the entity of all PFAS, extending well beyond the scope of current regulatory frameworks.
The US EPA estimates nearly 15,000 species in this group as manufactured compounds, precursors, and degradation products. This complicates their systematic and comprehensive monitoring. Due to the large number of PFAS compounds, only a limited fraction is accessible via reference standards or spectral databases, with many existing as isomers.
Consequently, conventional targeted analysis using TQ or high-resolution mass spectrometry (HRMS) encounters significant difficulties in achieving full coverage of this extensive chemical group. In response to the limited availability of standards and references, multiple initiatives have been established to compile PFAS data into suspect lists. The NORMAN network and NIST have developed suspect lists containing nearly 5,000 PFAS records.2,3,4
Novel Non-Targeted Approach for Comprehensive PFAS Analysis
A new non-targeted strategy is proposed for acquiring a holistic overview of PFAS, incorporating trapped ion mobility spectrometry (TIMS) with the mass spectral information from UHPLC-HRMS. The data is screened against traditional libraries and the suspect lists from NIST and NORMAN, enabling identification without needing reference libraries. This approach demonstrates enhanced performance over conventional methods with respect to time, reliability, and efficacy.
Methods
Sampling and Sample Preparation
Wastewater and surface water samples were obtained from 30 distinct locations across the Netherlands, representing various infrastructures such as industrial zones, urban areas, and natural or recreational regions. Solid-phase extraction was employed for sample purification and pre-concentration. Sample preparation followed the EPA 1633 regulation.
Samples were pre-concentrated by SPE using 25 mL of effluent from 200 mL of water. 50 μL of internal standards (IS) were introduced to the samples and the blanks. 4 mL 0.1% NH4 OH buffer in MeOH was used for conditioning, and 4 mL 0.1% NH4 OH in MeOH for elution and reconstitution. This yielded a 2,000-fold pre-concentration for surface water and 500-fold pre-concentration for effluents.
Analytical Workflow and PFAS Identification
2 μL of sample was injected into the LC/HRMS for a 20 min run time in negative ion mode. The MS method was optimized for PFAS with a parallel accumulation serial fragmentation (PASEF) acquisition workflow for non-targeted analysis for the suspect list screening.
The Elute UHPLC was equipped with a kit (Bruker) to remove PFAS originating from the tool. This system was coupled to the timsTOF Pro 2 (Bruker) with a high-sensitivity VIP-HESI (Vacuum Insulated Probe-Heated Electrospray Ionization) source. MS and MS/MS analyses were conducted in triplicate for each sample. Figure 1 outlines the analysis workflow. Following data acquisition and feature extraction, spectral library searches were performed in NIST and Bruker PFAS libraries.
Subsequently, the data was screened against the NORMAN network and NIST suspect lists. These lists contain basic information about the name, elemental composition, and InChI structure of almost 5,000 PFAS. Finally, unlisted compounds were identified using various MetaboScape® software (Bruker) instruments.
The MetaboScape software supports the ID Steps 2 and 3 using the following instruments:
- SmartFormula generates a list of potential elemental compositions for each compound.
- CompoundCrawler searches for corresponding structures for the proposed elemental compositions in databases and suspect lists.
- MetFrag applies comprehensive in-silico fragmentation using the structural information from InChI structures in the suspect lists or publicly available databases.5
- CCS-Predict Pro confirms the structure by comparing experimental CCS values and those predicted using the structural information from InChI structures in the suspect lists or from publicly available databases. Machine learning algorithms are employed to ensure high precision in CCS value prediction.6
Kendrick Mass Defect (KMD) Analysis for PFAS Detection
Filtration and reduction of specific features by Kendrick Mass Defect (KMD) plots is a popular method for detecting and identifying chemically related compounds based on their exact mass. KMD evaluation filters potential PFAS from the matrix background, based on the CF2 repeating units. KMD serves as a fundamental component of MetaboScape.
The Kendrick mass scale defines the mass of the recurring CF2 unit in PFAS with a nominal value of 50 Da. The KMD is derived from the exact mass decimals of the end group of the respective PFAS sub-species. In a diagram, the KMD is plotted against the m/z scale. Homologous PFAS species with the same end group share identical KMD, aligning horizontally in the KMD plot with the addition of more CF2 units. This enables differentiation from the remaining background signals.
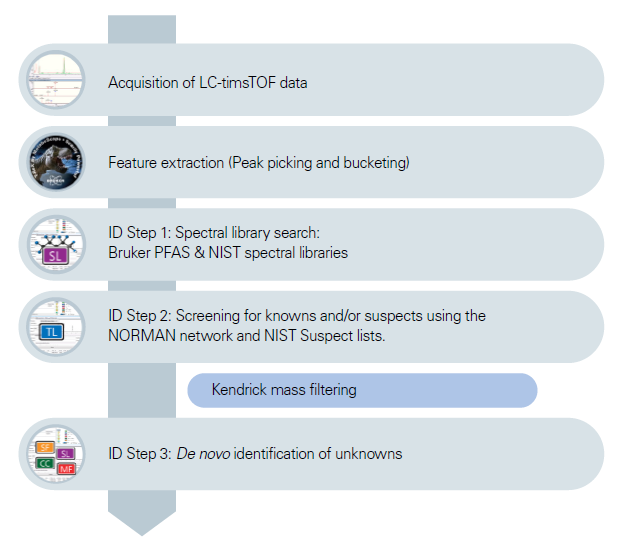
Figure 1. Workflow of the data acquisition, data treatment and identification of the potential PFAS candidates; ID Step = Identification Step. Image Credit: Bruker Applied Mass Spectrometry
Results
Utilizing TIMS for Enhanced PFAS Analysis
Recent approaches have applied high-resolution mass spectrometers (HRMS) to differentiate PFAS compounds through subtle differences in precise molecular weights and isotopic patterns. The primary challenge remains the low confidence in identifying many PFAS due to limited access to suitable, comprehensive libraries.
TIMS provides multiple ways to enhance performance when monitoring thousands of PFAS in a given sample. TIMS separates ions by their collisional cross sections (CCS), which are a function of shape and size. The ions are initially held stationary—or ‘trapped’—by the two opposing forces of a pushing gas pressure and a repelling electrical field. By gradually reducing the electrical potential, each ion species is released in a controlled manner, with those of greater cross-sectional area eluting ahead of their more compact counterparts (Figure 2).
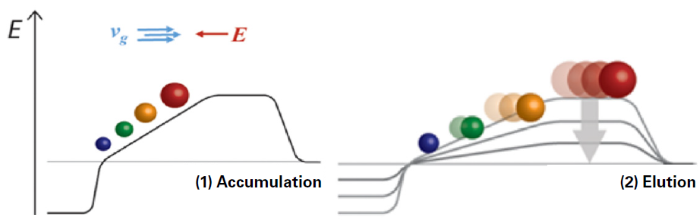
Figure 2. TIMS principle based on the parallel accumulation/trapping and serial release of compounds based on their 3-dimensional structure and size. Image Credit: Bruker Applied Mass Spectrometry
Collisional cross sections (CCS) thus serve as additional, orthogonal parameters to MS data, improving identification confidence. Additionally, TIMS ion trapping increases sensitivity and reduces PFAS detection limits via background elimination.
Lastly, it can be utilized to separate coeluting isobars and isomers, providing an additional separation to UHPLC-HRMS. This holds significant biochemical interest since physicochemical characteristics, such as those of linear and branched structures, may exhibit slight variance, leading to biochemical reaction and transformation differences, bioaccumulation, and risk of toxic exposure.
Studies indicate that linear PFAS sorb preferentially to soil and sediments, while branched isomers are more likely to persist in water due to their increased polarity. Human serum samples can contain higher levels of branched PFOS compared to the ratio that is usually seen in the production of PFOS by electrochemical fluorination (70% linear).7
Enhanced Detection and MS/MS Coverage with PASEF
Figure 3 displays the heat map for a representative sample from ten different wastewater collection sites. The raw MS data exhibits over 8,600 detected features after extraction, underscoring the sample’s complexity.
Since PASEF provides a considerably rapid MS/MS speed of >150 spectra/sec, MS/MS spectra cover 58% of all features. This uniquely high coverage is essential for ensuring the detection of compounds of interest, supporting comparison with in-silico fragments, and achieving final identification.
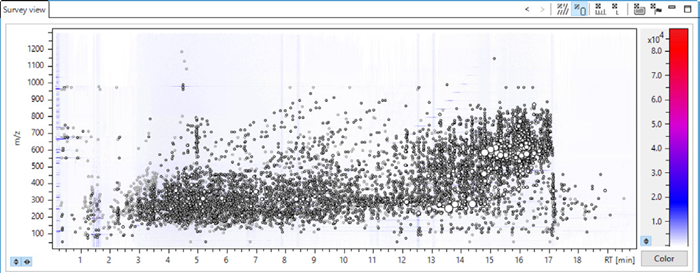
Figure 3. Heat map for an effluent sample from The Netherlands. The retention time is plotted against the detected m/z with a color coding for the signal intensity. 8654 features have been detected after T-Rex processing (RT alignment of multiple features, recursive extraction of different ion species for the same compound). Image Credit: Bruker Applied Mass Spectrometry
Simplifying Data Complexity with Kendrick Mass Defect
Kendrick mass defect (KMD) evaluation was employed in MetaboScape to filter PFAS signals from many other naturally occurring matrix compounds and reduce data complexity.
In this application, KMD filters potential PFAS from the matrix background based on the CF2 repeating units. Candidates potentially related to PFAS appear as horizontal lines with discrete data points for the increasing CF2 units along the m/z scale (Figure 4). The high mass accuracy the timsTOF Pro 2 provides is a key factor for efficient filtering.
Approximately 20,000 properties were detected from all effluents and surface water samples of the 30 sampling sites. After KMD filtering, approximately 500 potential PFAS candidates remained. This highly effective data reduction limits subsequent data analysis to relevant features only.
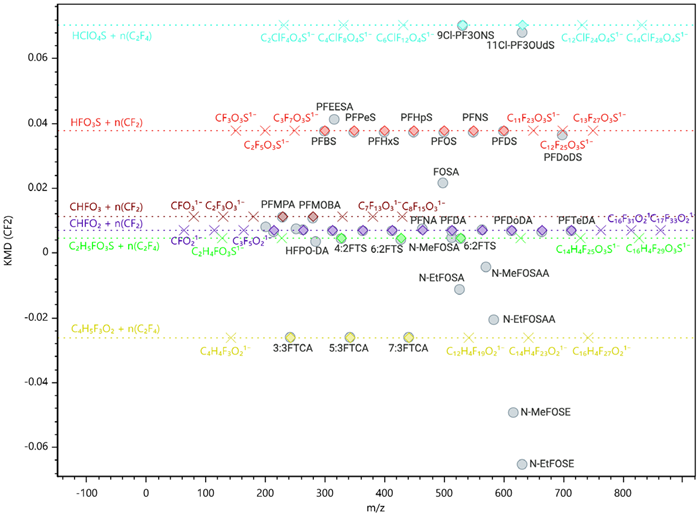
Figure 4. Part of the KMD plot for a standard mixture according to the EPA Method 1633. PFAS of the same group are aligned in horizontal chains representing the addition of CF2 units. MetaboScape supports the visualization and extension of these homologous rows. Image Credit: Bruker Applied Mass Spectrometry
Multi-Criteria Approach for Confident PFAS Identification
Figure 5 presents a summary of results in MetaboScape, including an example of the experimental and library spectra match for a representative compound. For suspect list screening (ID Step 2) and de novo identification (ID Step 3), the combination of four different search criteria—exact mass, isotope pattern, MS/MS fragmentation and CCS value—was utilized.
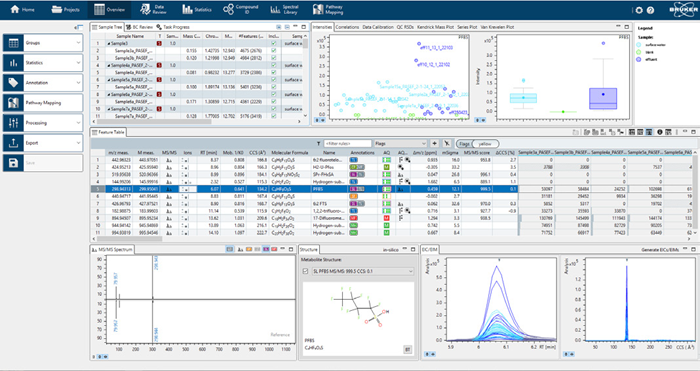
Figure 5. Overview of the results in MetaboScape with a butterfly overlay of the experimental and the spectral data for a representative compound. Image Credit: Bruker Applied Mass Spectrometry
The first two criteria were compared with the elemental compositions in the lists to generate a shortlist of candidates. The corresponding structures of these candidates from the suspect list (InChI) or public databases such as MetLin and PubMed were fragmented in silico by MetFrag and compared with the experimental MS/MS feature data.
Finally, experimental CCS (collisional cross section) values of remaining candidates were compared with machine learning-based predictions from the structures for the found suspects (CCS-Predict Pro). The combined match of these multiple orthogonal criteria generated a highly confident assignment of PFAS species without using reference standards.
Comprehensive PFAS Annotation in Wastewater
A total of 142 compounds in wastewater were annotated through a combination of steps: 12 were annotated via library search (ID Step 1, dark blue), 14 through the suspect lists (ID Step 2, light blue), and 116 via de novo approach (ID Step 3) (Figure 6). This outcome emphasizes the necessity of utilizing high-information datasets, as numerous PFAS were detected that are absent from both libraries and suspect lists.
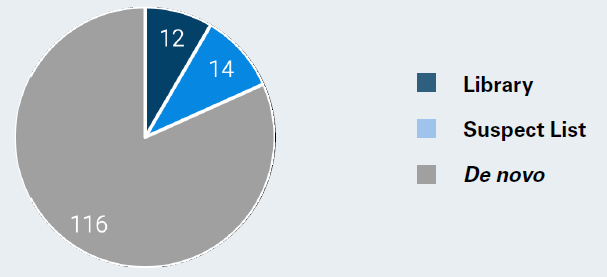
Figure 6. The identification of 142 compounds in wastewater was achieved through various steps: 12 were annotated via library search (ID Step 1, dark blue), 14 through the suspect lists (ID Step 2, light blue), and 116 using the de novo approach (ID Step 3, grey). Image Credit: Bruker Applied Mass Spectrometry
PFAS Distribution and Detection in Surface Water
In surface water samples, 137 features were annotated as PFAS. As expected from their local conditions and infrastructure, the quantity of detected PFAs varied among different sampling sites. Figure 7 compares these numbers across 18 sites.
Elevated contamination levels were observed at sites 1, 13 and 17, while lower contamination levels were visible at sites 4 and 15. Multiple PFAS precursors and degradation products were discovered that had not yet been screened in any legal directives and would have been missed in a targeted approach. In such cases, while targeted compounds would be quantified at low levels, the degradation products may exist at elevated levels, posing a potential hazard and health risks.
One example is H2-U-PFOS, identified in step 3. This unsaturated PFOS has previously been detected in the environment, although no commercial standard is currently available. Compounds of this type cannot be detected using existing target or library search methods.
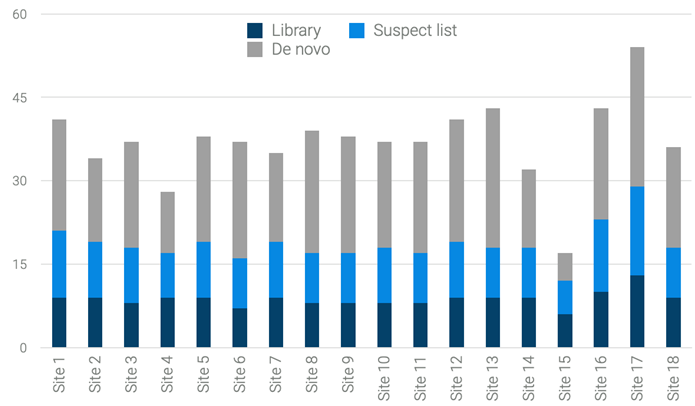
Figure 7. Number of PFAS compounds found at the different surface water sites. While a higher number was observed e.g., at the sides 1, 13 and 17, lower contamination is visible e.g., at the sites 4 and 15. This is possibly due to the local infrastructure and environmental circumstances. Image Credit: Bruker Applied Mass Spectrometry
Scoring Framework for Non-Target PFAS Analysis
The certainty of PFAS identifications based on HRMS data must be conveyed using a dependable and harmonized framework. Charbonnet et al. have recently proposed a confidence scale along with identification criteria tailored specifically for suspect or non-target analysis of PFAS by HRMS. Confidence levels range from 1a (Confirmed by Reference Standard) and 1b (Indistinguishable from Reference Standard) to 5 (Exact Masses of Interest).8
Incorporating structural data into the identification workflow by MS/MS and CCS values predominantly yields scoring levels of 1 and 2 (Table 1), thereby validating the reliability and high confidence of the combined Ion Mobility-HRMS methodology.
Additionally, the KMD filtering supports higher scores by annotating homologous compound series (level 2c). The study reinforces the necessity of non-target PFAS research and demonstrates the high sensitivity of the workflow in successfully identifying previously unknown or unanticipated PFAS products, precursors, and degradation compounds.
Table 1. Charbonnet scorings and respective results from the ion mobility-HRMS workflow presented here. The combination of mass accuracy, library search and structural information by MS/MS and CCS values results in scoring levels of 1 and 2. Source: Bruker Applied Mass Spectrometry
| Level |
Identification confidence |
ID step |
| 1a |
Confirmed by reference standard |
BDAL PFAS library including in-batch analysis of CRS |
| 1b |
Indistinguishable from reference standard |
BDAL PFAS library |
| 2a |
Probable by library spectral match |
NIST PFAS library |
| 2b |
Probable by diagnostic fragmentation evidence |
Suspect list including in-silico fragmentation for MS/MS and CCS prediction |
| 2c |
Probable by diagnostic homologue evidence |
Homologues PFAS series from KMD plots |
| 3a |
Positional isomer candidates |
|
| 3b |
Fragmentation-based candidate |
|
| 3c |
Circumstantial candidate with fragmentation evidence |
|
| 3d |
Circumstantial candidate with homologue evidence |
|
| 4 |
Unequivocal molecular formula |
|
| 5a |
PFAS suspect screening exact mass match |
Just MS data comparison with suspect lists |
| 5b |
Nontarget PFAS exact mass of interest |
|
Conclusions
Addressing Analytical Challenges in PFAS Detection
Rigorous regulatory obligations increase the demand for robust and dependable PFAS detection and identification, yet the analytical difficulties remain considerable. Although thousands of PFAS exist, standards and libraries remain limited. Samples frequently contain compounds of interest in complex matrices.
Comprehensive 4D Workflow for PFAS Identification
This study outlines an innovative and unique strategy for matching high-quality 4D data of exact mass, isotope pattern, MS/MS, and CCS with data obtained from libraries and large suspect lists. Utilization of the timsTOF Pro 2 and MetaboScape in combination with the “3 ID steps” indicates that all three annotation instruments were employed in sequential order to annotate one feature.
Library search, NIST or NORMAN network PFAS suspect list screening, and de novo compound elucidation proved an effective method for rapid and efficient identification of unknown PFAS in complex environmental matrices. It represents an intuitive workflow supported by automated feature finding and consecutive annotation, resulting in immediate results and data generation.
Advancing PFAS Analysis Beyond Targeted Methods
This method extends the PFAS analysis beyond the limitations of conventional targeted methodologies, allowing detection of a virtually limitless number of PFAS, including isomers in complex matrices. The strategy advances PFAS analysis to a level aligned with societal goals towards greater health and environmental protection and security for the future, beyond the scope of existing regulatory mandates.
References and Further Reading:
- Computational Toxicology and Exposure Online Resources. CompTox Chemicals Dashboard. (online) Available at: https://comptox.epa.gov/dashboard/chemical-lists/PFASSTRUCT.
- NORMAN. NORMAN Substance Database. (online) Available at: https://www.norman-network.com/nds/susdat/.
- Benjamin Place (2021), Suspect List of Possible Per- and Polyfluoroalkyl Substances (PFAS),
- National Institute of Standards and Technology, https://doi.org/10.18434/mds2-2387 (Accessed 2024-11-15)
- Wolf, S., et al. (2010). In silico fragmentation for computer assisted identification of metabolite mass spectra. BMC Bioinformatics, 11(1). https://doi.org/10.1186/1471-2105-11-148.
- Zhou, Z., et al. (2020). Ion mobility collision cross-section atlas for known and unknown metabolite annotation in untargeted metabolomics. Nature Communications, 11(1). https://doi.org/10.1038/s41467-020-18171-8.
- Miralles-Marco, A. and Harrad, S. (2015). Perfluorooctane sulfonate: A review of human exposure, biomonitoring and the environmental forensics utility of its chirality and isomer distribution. Environment International, (online) 77, pp.148–159. https://doi.org/10.1016/j.envint.2015.02.002.
- Charbonnet, J.A., et al. (2022). Communicating Confidence of Per- and Polyfluoroalkyl Substance Identification via High-Resolution Mass Spectrometry. 9(6), pp.473–481. https://doi.org/10.1021/acs.estlett.2c00206.

This information has been sourced, reviewed and adapted from materials provided by Bruker Applied Mass Spectrometry, developed in collaboration with Vrije Universiteit Amsterdam.
For more information on this source, please visit Bruker Applied Mass Spectrometry.