New methods are currently being developed to analyze a range of parameters in-situ; for example, the pH, nickel concentration and reducing agent concentration of electroless nickel baths.
These developments have the potential to enable automated control of the deposition process on the production line.
This article explores examples of analytical techniques developed for use in an automated chemical monitoring system. An evaluation of these techniques is also presented, including thousands of data points collected to evaluate the system’s performance.
PCB manufactures must comply with regulations that prohibit the use of lead, requiring the widespread use of alternative finishes such as ENIG (Electroless Nickel/Immersion Gold), immersion tin, and immersion silver.
ENIG, in particular, offers a highly solderable surface that does not discolor or tarnish, therefore ensuring a comparatively long storage time when compared against other alternative finishes.
ENIG is also regarded as an effective barrier, averting copper diffusion and ensuring that PCB pads maintain solderability.
A potential downside to the ENIG finish is the likelihood of nickel corrosion during immersion gold deposition. This defect is often referred to as ‘black nickel’ or ‘black pad.’1 Black pads generally lead to solderability failure, so these should be avoided.
The nickel layer’s structure and the phosphorous content are key factors in determining subsequent black pad formation, with these factors related to the pH and composition of the bath used for electroless nickel deposition.
Therefore, the key to defect-free ENIG processes is maintaining precise control of the electroless nickel bath.
Bath properties will change as the solution ages, occurring via the consumption of components and the creation of by-products.
Proper control of the bath requires accurate information on the bath’s properties, allowing adjustments to be made accordingly. With this in mind, the ability to accurately analyze bath properties is the first step towards the effective control of electroless nickel baths.
Electroplating relies on an external circuit to provide sufficient electrons to reduce metal ions into metal deposits, but an electroless process must utilize reducing agents to provide these electrons.
Sodium hypophosphite is the most common reducing agent used in electroless nickel baths.
This article explores an approach to the analysis of divalent nickel (Ni2+), sodium hypophosphite concentrations and the bath’s pH.
Analytical Methods and Results
A Quali-Stream inline chemical monitoring system from ECI Technology, Inc. (Figure 1) was used to analyze pH and nickel concentration.
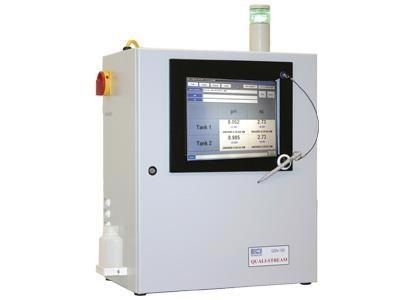
Figure 1. Quali-Stream inline bath analyzer used in this work for controlling electroless nickel baths. Image Credit: ECI Technology
The system is able to sample and analyze solutions alternately from two production tanks. This process is based on predefined schedules, with solutions automatically returned to their original production tanks once analysis has been completed.
Solution inlets and outlets for various tanks can be found on the system’s left side panel.
Nickel concentration analysis is performed using a spectroscopic method based on Beer’s Law. Incoming light is partially absorbed by the solution being analyzed, meaning that higher nickel concentrations result in stronger absorbance and, therefore, a weaker outgoing optical signal in the corresponding wavelength ranges.
Outgoing light is collected using fiber optics before being transported to an internal high performance detector for sensitive, accurate analysis.
A calibration curve is constructed by measuring the absorbance of solutions of known different nickel concentrations that have been carefully prepared in advance (Figure 2).
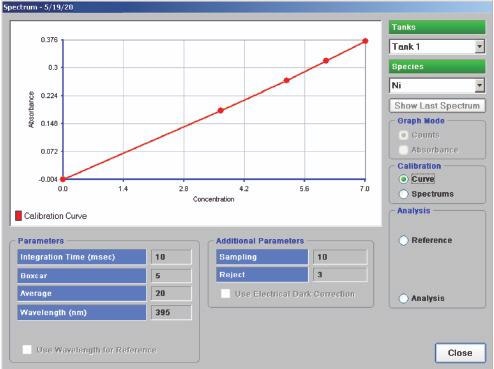
Figure 2. Calibration curve of nickel concentration. Image Credit: ECI Technology
Tank solution absorbance is measured with corresponding nickel content determined by mapping the absorbance to the calibration curve. This is an automatic process performed by specialist software in order to eliminate any contributions from other species.
Performance test results of the system measuring divalent nickel concentration are displayed in Figure 3.
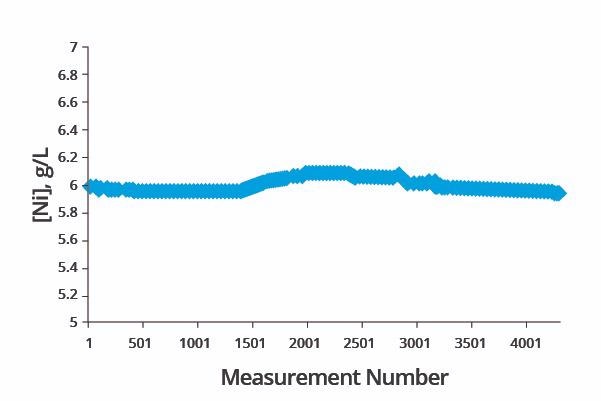
Figure 3. Performance check of nickel concentration analysis. Image Credit: ECI Technology
Over 4,000 data points were collected over three days, with the spectrometer automatically calibrating itself at appropriate intervals.
Figure 3 confirms that the analytical method achieved very high accuracy when analyzing the same standard solution of 6.0 g/l nickel concentration. The highest reading during the test period was found to be 6.094 g/l, while the lowest reading was recorded as 5.922 g/l.
The method’s high reliability was further confirmed via statistical analysis of the data set, which was found to have a relative standard deviation of 0.86%.
Measurement of pH was performed using the pH meter built into the Quali-Stream analyzer. The system’s long-term performance test of pH measurement is displayed in Figure 4.
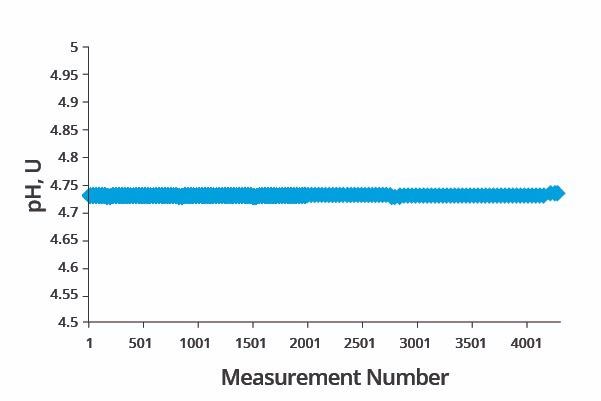
Figure 4. Performance check of pH analysis. Image Credit: ECI Technology
Over 4,000 data points were acquired at the same time as the nickel concentration test was conducted. The pH output reading was held in a narrow range throughout the three day period. The max reading was found to be 4.727 pH unit, while the minimum reading was found to be 4.740 pH unit.
Statistical analysis of the data set revealed a relative standard deviation of 0.06%. A further set of tests was performed to confirm the accuracy of the system’s pH measurements. This second set of performance tests involved measuring the pH of one buffer solution at a number of different temperatures.
It has been well documented that pH readings change in line with the solution’s temperature, even when measuring the same solution over time. Figure 5 (blue data set) displays the pH versus temperature results of this experiment.
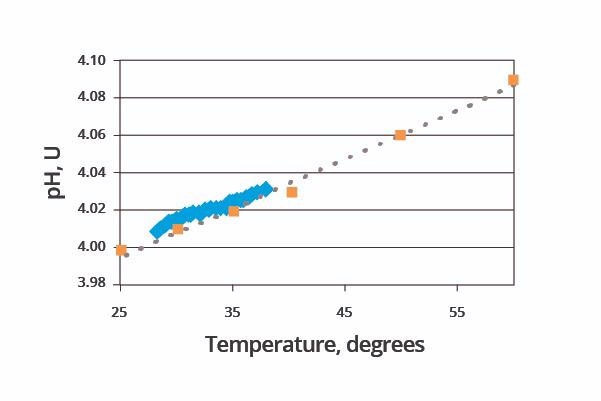
Figure 5. Results of measuring pH buffer at multiple temperatures. Image Credit: ECI Technology
This matches very closely with published data (pink data set), verifying the system’s performance.
CVS (Cyclic Voltammetric Stripping) was used to analyze reducing agents. This is the most widely adapted means of determining organic component concentrations in a copper electroplating bath.2
A QualiLab plating bath analyzer from ECI Technology, Inc. was used in this example. Sodium hypophosphite concentration was analyzed using the CVS technique, applying a cyclic potential onto a platinum working-electrode immersed in the working solution.
The solution contains copper ions alongside a precisely diluted bath sample from the process tank being analyzed.
Cyclic potential moves between pre-determined positive and negative limits. Copper is deposited onto the working electrode during the negative potential part of the cycle before being stripped away during the positive potential part of the cycle.
Concentrations of additives located in the solution will impact the rate of copper plating onto the working electrode.
The deposition rate of copper in the working solution was found to increase monotonically as the reducing agent concentrations increase. It should be noted that Cu is the working metal used within the CVS analysis, though it is the reducing agent concentration in electroless nickel solution that is actually being analyzed.
Figure 6 shows the impact of hypophosphite concentration on voltammogram – I-V diagram monitoring the CVS progress.
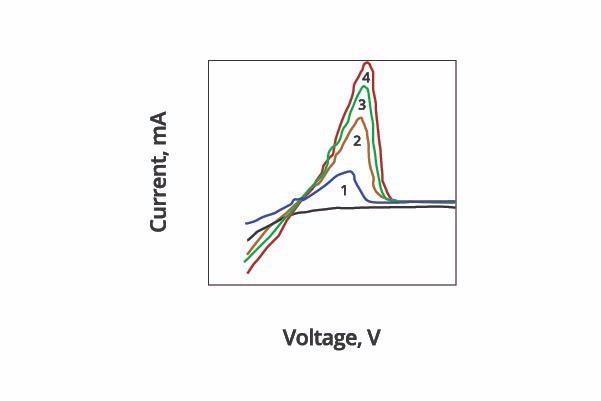
Figure 6. Effect of hypophosphite concentration (#1 < #2 < #3 < #4) on Voltammogram. Image Credit: ECI Technology
Four carefully as-prepared test solutions of varying hypophosphite concentrations provided distinct I-V curves during voltage scan.
Enclosed areas underneath the curves (referred to as ‘peak area’ or Ar) were found to correspond to the integration of current against applied voltage. These areas are therefore proportional to the speed of plating or stripping.
It is possible to construct a calibration curve (Figure 7) of plating peak area vs. hypophosphite concentration, allowing the peak area of an unknown solution to be compared in order to determine its hypophosphite concentration.

Figure 7. Calibration curve of CVS peak area vs. hypophosphite concentration in the solution. Image Credit: ECI Technology
Long-term statistics confirmed that utilizing CVS to measure hypophosphite concentration had the potential to achieve better than 4% relative accuracy as well as 3.5% repeatability.
Summary and Conclusion
Approaches to analyzing pH and nickel concentration in electroless nickel baths are outlined above, and engineering efforts based on appropriate expertise have led to the integration of these new methods into a single automated system.
This new system facilitates the real-time analysis of tank solutions in PCB production environments.
Corresponding long-term results confirmed the measurements’ high accuracy and repeatability. Closed-loop dosing based on these analytical results can safeguard the stability of the electroless nickel bath, affording production engineers complete control of their parts’ quality.
It is possible to measure the reducing agent in the electroless nickel solution using CVS technique and a separate lab analyzer, though sampling from the tank would need to be performed manually in this instance.
Similar analytical approaches with comparable accuracies have also been established for the analysis of electroless copper solution, electroless cobalt solution and palladium activation solution. Discussions on some of these topics are also available.3
References
- George Milad and Jim Martin, “Electroless Nickel/Immersion Gold, Solderability and Solder Joint Reliability as Functions of Process Control,” CircuiTree, October 2000.
- D. Tench and C. Ogden, “A New Voltammetric Stripping Method Applied to the Determination of the Brightener Concentration in Copper Pyrophosphate Plating Baths,” J. Electrochem. Soc. n. 125, p. 194 (1978).
- P. Bratin, et. Al., “Development of Chemical Metrology for Electroless Deposition Baths,” ISTC Proceedings, March 2006.
Acknowledgments
Produced from materials originally authored by Eugene Shalyt, Semyon Aleynik, Michael Pavlov, Peter Bratin and Chenting Lin from ECI Technology.

This information has been sourced, reviewed and adapted from materials provided by ECI Technology.
For more information on this source, please visit ECI Technology.