One critical ingredient in beer is hops. In the taste of many beers, they supply a crucial balance to the malt. They also aid the brewing process during the boil in precipitating out proteins, etc. Hops also have preservative properties that help keep beer fresh and free from bacteriological attacks.
Hops contribute to the taste of beer in three ways:
- Flavoring – compounds like esters and terpenes supply the earthy, fruity, citrus, resiny flavors to numerous beers.
- Aroma compounds – these are the volatile organic compounds that migrate into the vapor above the head of beer and give the beer its characteristic smell. This can be fruity, flowery, citrusy, etc. They form a vital part of the overall flavor of beer.
- Bittering – hops contain compounds such as humulone which are insoluble in water but isomerize on boiling to form isohumulones, which impart the bitter flavor to beer and are partially soluble.
There are various varieties of hops that supply a large variety of flavors. Since the flavor will degrade as they age, hops must be stored carefully and be utilized when fresh. Consequently, there is a requirement to characterize the quality of hops so that the brewer can develop and deliver the product required.
There are many compounds in hops that contribute to flavor, so aroma characterization of hops is complicated. The composition of typical hops is listed in Table 1, and Table 2 lists some of the key aroma compounds.
Table 1. Composition of typical hops. Source: PerkinElmer Food Safety and Quality
| Component |
% |
| Vegetative material (cellulose, lignin, etc.) |
40 |
| Proteins |
15 |
| Total resins (bittering compounds) |
15 |
| Water |
10 |
| Ash |
8 |
| Lipids, wax, pectin |
5 |
| Tannins |
4 |
| Monosaccharides |
2 |
| Essential oils (flavor/aroma compounds) |
0.5 to 2 |
Table 2. Key hop aroma compounds. Source: PerkinElmer Food Safety and Quality
| Component |
Comment |
| Myrcene |
Pungent flavor; normally oxidized during the boil into other flavor compounds such as linalool and geraniol and their oxides |
| Humulene |
Delicate and refined flavor characteristic of noble hops; broken down by boiling into oxidative flavors |
| Caryophyllene and farnesene |
Herbal spicy character -- not well characterized |
The traditional way to assess hop quality is to use an experienced brewer to assess the hops organoleptically by crushing a few of the hops in their fingers and smelling the released aroma. This is effective but not objective and lacks the quantitative information required to make correct decisions on how to use the hops.
This study outlines a system that can supply both an objective chemical analysis of hop aroma by utilizing gas chromatography/mass spectrometry and, simultaneously, supply the means for the user to monitor the olfactory character of each component as it elutes from the chromatographic column.
A method like this enables the user to gain a fuller characterization of a particular hop sample.
Analytical System
The analytical system is made up of five main components.
HS Trap
Static headspace (HS) sampling is well suited for extracting aroma compounds out of hops. As shown in Figure 1, a weighed amount of hops (pellets or leaves) is placed in a glass vial and sealed.
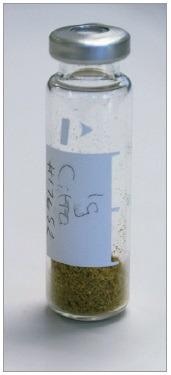
Figure 1. Hops inside a headspace vial awaiting analysis. Image Credit: PerkinElmer Food Safety and Quality
Next, this vial is heated in an oven for a set fixed time period at a set fixed temperature. The headspace sampling system extracts Some of the vapor from the vial, and it is introduced into the GC column for separation and analysis.
It is extremely convenient, but static headspace sampling only supplies a fraction of the headspace vapor into the GC column, so it is really best suited to high concentrations of compounds.
It is often discovered that low levels of some components are vital to the overall aroma of that sample in the analysis of complex samples.
A headspace trap system was utilized to increase the amount of sample value introduced into the GC column. Most or even the entire headspace vapor is passed through an adsorbent trap to gather and focus the VOCs by using this technology. The trap is then quickly heated, and the desorbed components are transferred to the GC column.
Using this method, the amount of sample vapor entering the GC column can be increased by a factor of up to 100x. It is ideally suited for hop aroma analysis.
Figures 2 to 4 are simplified representations of the HS trap operation – there are other valves and plumbing which are required to ensure that sample vapor goes where it should.

Figure 2. Schematic diagram of the HS trap system showing the equilibrated vial being pressurized with carrier gas. Image Credit: PerkinElmer Food Safety and Quality
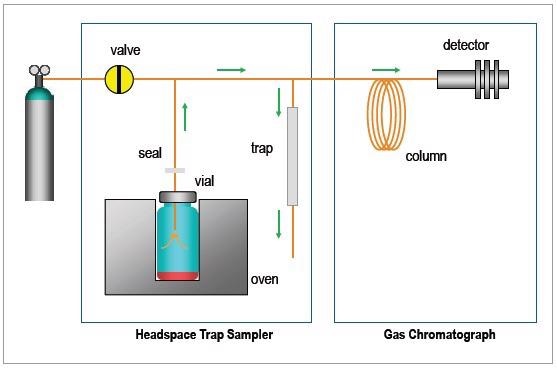
Figure 3. Schematic diagram of the HS trap system showing the pressurized headspace being released from the vial into the adsorbent trap. Image Credit: PerkinElmer Food Safety and Quality
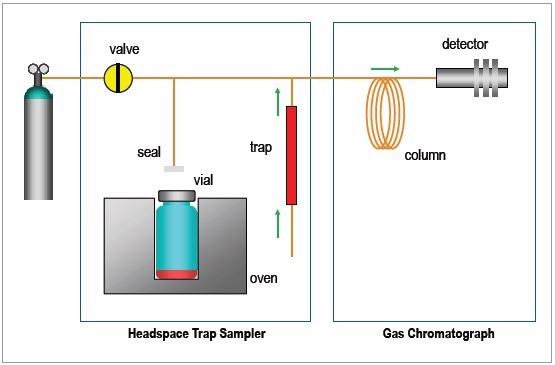
Figure 4. Schematic diagram of the HS trap system showing the VOCs collected in the adsorbent trap being thermally desorbed and introduced into the GC column. Image Credit: PerkinElmer Food Safety and Quality
The principle is essentially very similar to classical static headspace, but it is fully vented through an adsorbent trap at the end of the vial equilibration step after the vapor is pressurized.
To effectively vent the entire headspace vapor through the adsorbent trap, this process may be repeated. Once the trap is loaded, it is quickly heated, and the desorbed VOCs are transferred to the GC column.
Clarus 680 GC
The workhorse Clarus® 680 GC is an ideal complement to the rest of the system. Simple techniques may be employed as the chromatography is undemanding. It is crucial to have sufficient time between adjacent peaks for olfactory monitoring so that the user can discern them from each other.
It is also advantageous to load the column with as much of the sample as possible without overload to supply the best opportunity for the user’s nose to detect them. A long column with a thick stationary phase is used for this reason.
A very polar Carbowax®-type stationary phase is utilized for the separation because many of the components in hops are highly polar (ketones, acids, esters, etc.).
S-Swafer System
Some form of splitting device is required as the column effluent needs to supply both the MS and the olfactory port. This should not influence the integrity of the chromatography in any way. Therefore, it should be highly inert and have low-volume internal geometry.
The utilization of a make-up gas in the splitter supplies further stability and control of the split flow rates. S-SwaferTM is an excellent active splitting device and is ideal for this purpose.
The S-Swafer configured to split the column effluent between the MS detector, and the SNFR olfactory port is shown in Figure 6. The split ratio between the detector and the olfactory port is defined by choice of restrictor tubes connected between the Swafer outlets and the MS and SNFR.
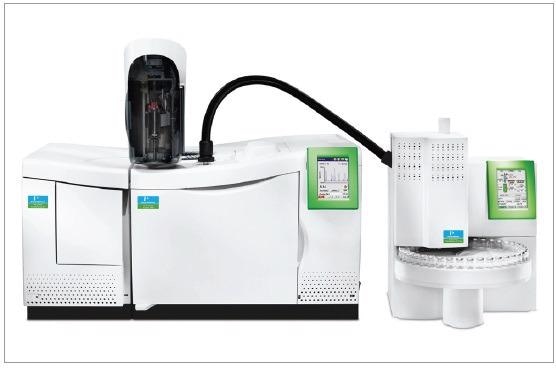
Figure 5. The Clarus 680 SQ 8 GC/MS system. Image Credit: PerkinElmer Food Safety and Quality
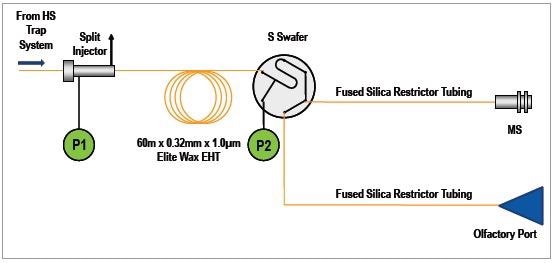
Figure 6. S-Swafer configured for use with the Clarus SQ 8 GC/MS and the SNFR. Image Credit: PerkinElmer Food Safety and Quality
Included with the Swafer system, the Swafer utility software can be utilized to calculate this split ratio. Figure 7 shows how this calculator was employed to determine the operating conditions for the S-Swafer for this application.
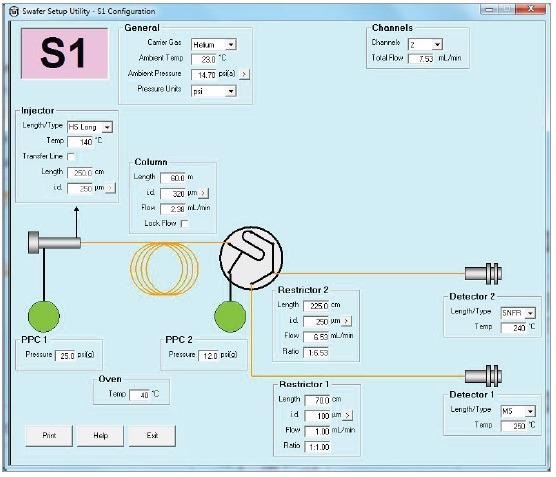
Figure 7. The Swafer utility software showing the settings used for this hop aroma characterization work. Image Credit: PerkinElmer Food Safety and Quality
Clarus SQ 8 Mass Spectrometer
A mass spectrometer is a key part of an aroma characterization system. It is crucial not only to detect and describe the aromas of the various components eluting from the GC column but also to identify what those components are and possibly what their levels in the hops are.
For this purpose, the Clarus SQ 8 quadrupole mass spectrometer is ideally suited and will identify and quantify components quickly, utilizing classical spectra in the supplied NIST library. This software can also interact with the olfactory information as described later in this study.
GC SNFR Accessory
An image of the SNFR accessory is depicted in Figure 8. This is connected to the GC via a flexible heated transfer line. The split column effluent travels to the glass nose-piece through deactivated fused silica tubing.
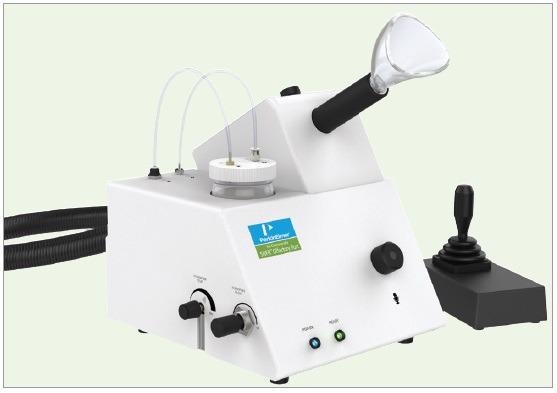
Figure 8. The SNFR olfactory port accessory. Image Credit: PerkinElmer Food Safety and Quality
The user can capture vocal narration via a built-in microphone and aroma intensity by the adjustment of a joystick while monitoring the aroma compounds eluting from the GC column.
Analytical Conditions
Table 3. HS Trap conditions. Source: PerkinElmer Food Safety and Quality
| . |
. |
| Headspace system |
PerkinElmer® TurboMatrix™ 110 HS Trap |
| Vial equilibration |
80 °C for 15 minutes |
| Needle |
120 °C |
| Transfer line |
140 °C, column connected directly to HS trap |
| Carrier gas |
Helium at 25 psig |
| Dry purge |
5 min |
| Trap |
Air toxics, 30 °C to 300 °C, hold for 5 min |
| Extraction cycles |
1 with 40 psig extraction pressure |
Table 4. GC conditions. Source: PerkinElmer Food Safety and Quality
| . |
. |
| Gas Chromatograph/ Mass Spectrometer |
PerkinElmer Clarus 680 SQ 8 |
| Column |
60 m x 0.32 mm x 1.0µm Elite-5MS connected directly to the HS trap |
| Oven |
40 °C for 2 min, then 4 °C/min to 240 °C for 8 min |
| Carrier gas |
13 psig at Swafer |
| Injector |
PSS at 300 °C, carrier gas off |
Table 5. MS conditions. Source: PerkinElmer Food Safety and Quality
| . |
. |
| Scan range |
m/z 35 to 350 |
| Scan time |
0.8 s |
| Interscan delay |
0.1 s |
| Source temp |
250 °C |
| Inlet line temp |
250 °C |
Table 6. Olfactory port conditions. Source: PerkinElmer Food Safety and Quality
| . |
. |
| Olfactory port |
PerkinElmer SNFR |
| Transfer line |
225 cm x 0.250 mm at 240 °C |
| Humidified air |
500 mL/min with jar set to 37 °C |
Table 7. Swafer conditions. Source: PerkinElmer Food Safety and Quality
| . |
. |
| Swafer |
PerkinElmer S-Swafer in the S1 configuration |
| Settings |
Developed using the Swafer utility software – see Figure 7 |
Table 8. Sample details. Source: PerkinElmer Food Safety and Quality
| . |
. |
| Sample preparation |
Hops (leaves or pellets) were ground with a rotary coffee grinder and 1 g was weighed into a sample vial and sealed |
| Vial |
Standard 22-mL vial with aluminum crimped cap with PTFE lined silicone septum |
Typical Chromatography
Figure 9 depicts total ion chromatograms (TIC) of four typical hops from different countries. Part of the German Hallertau is highlighted and is expanded in Figure 10.
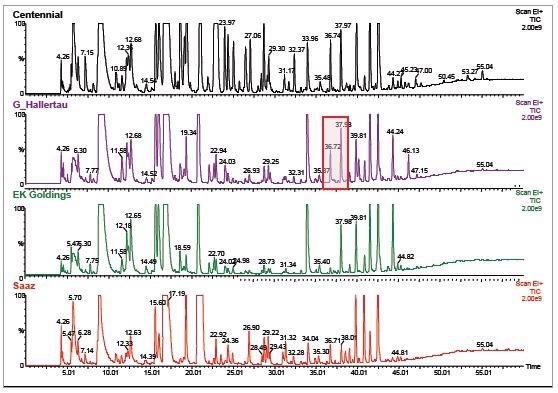
Figure 9. Typical TIC chromatograms of four hop samples. Image Credit: PerkinElmer Food Safety and Quality
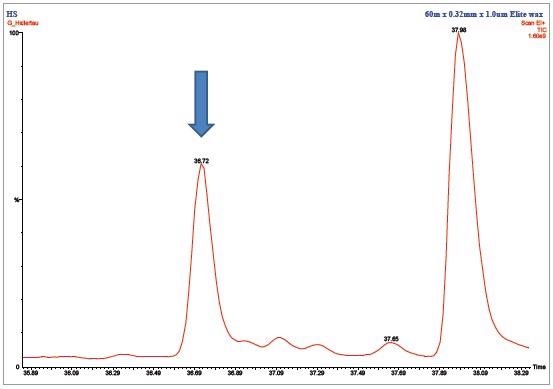
Figure 10. Highlighted detail from Figure 9. Image Credit: PerkinElmer Food Safety and Quality
As shown in Figure 11, the power of the MS allows a particular peak to be identified from its mass spectrum by searching the NIST spectral library supplied with the Clarus SQ 8 system.
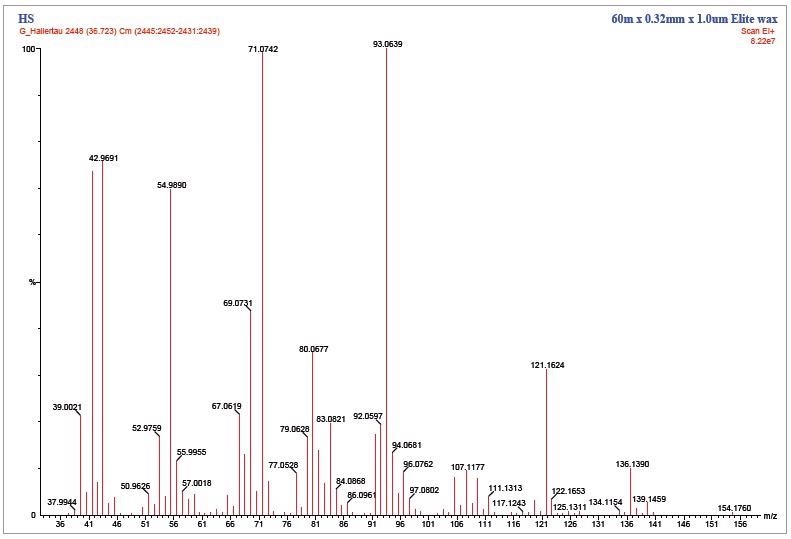
Figure 11. Mass spectrum from peak highlighted in Figure 10. Image Credit: PerkinElmer Food Safety and Quality
Figure 12 shows the results of this search, and they very strongly indicate that the peak eluting at 36.72 minutes is 3,7-dimethyl-1,6- octadien-3-ol, otherwise known as linalool.
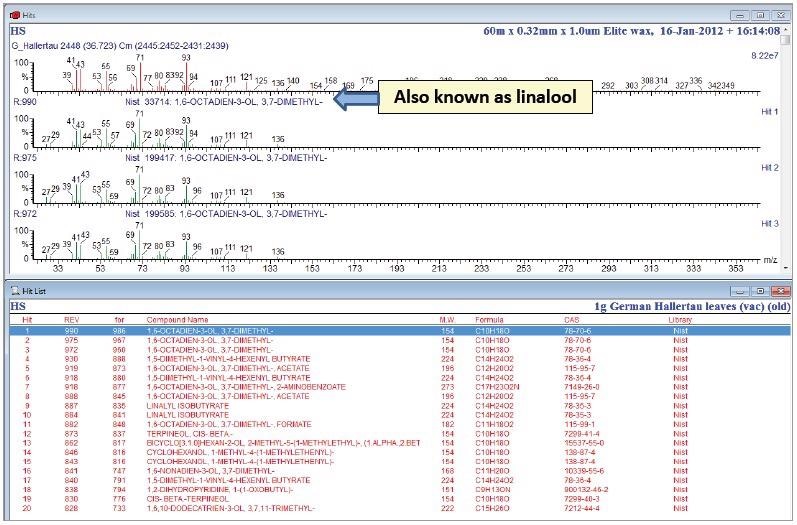
Figure 12. Results from library search on mass spectrum shown in Figure 11. Image Credit: PerkinElmer Food Safety and Quality
Linalool is a vital aroma compound and will supply a delicate flowery aroma to the beer. By calibrating the GC/MS with standard mixtures of this compound, the amount of linalool (or any other compound once identified) may be quantified.
A profile of the hop character may be established by carrying out further identification of the chromatographic peaks. Figure 13 demonstrates further peaks identified in the German Hallertau chromatogram previously shown in Figure 9.
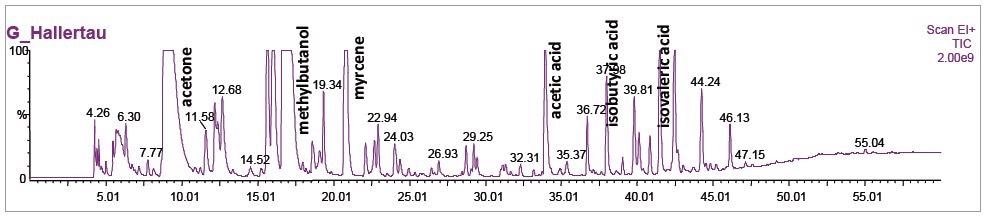
Figure 13. Typical TIC chromatograms of four hop samples. Image Credit: PerkinElmer Food Safety and Quality
Annotated peaks are mainly aliphatic acids which indicate a degree of oxidation in the hops in this particular sample. The strongly flavored myrcene peak is a bit smaller than expected.
These observations indicate that this sample is rather old (which was true – this was an old sample that had been stored poorly). The chromatography of four additional hop samples is shown in Figure 14.
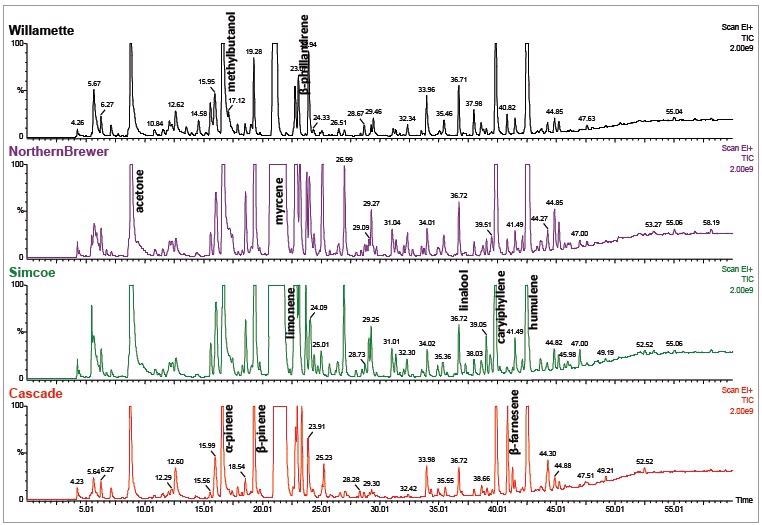
Figure 14. TIC chromatograms of a further four hop sample. Image Credit: PerkinElmer Food Safety and Quality
Olfactory Characterization
Figure 15 shows an example of a hop chromatogram with the audio narration and intensity recordings graphically overlaid. Audio narration is stored in a standard WAV file format which can be replayed from this screen to the operator from any point in the displayed chromatogram by means of a simple mouse-click.
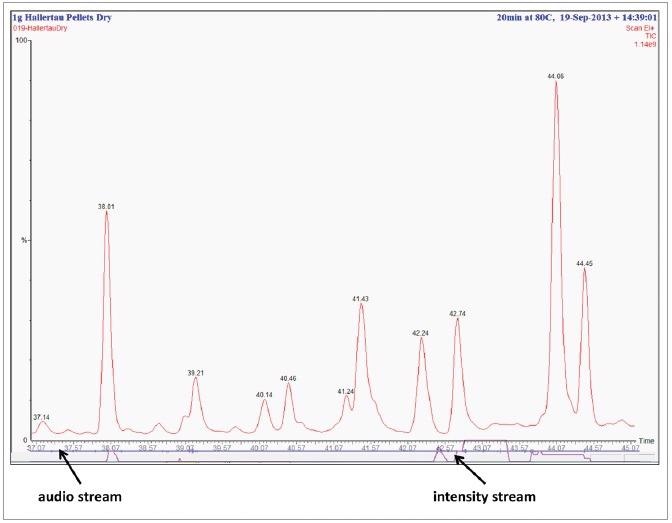
Figure 15. Example of a hop chromatogram being reviewed within the TurboMass™ software with the audio narration and aroma intensity graphically overlaid. Image Credit: PerkinElmer Food Safety and Quality
The narration WAV file can also be played back from the majority of media applications, including the Microsoft® Media Player, which is included with the Windows® operating system. At the time of the recording, the audio data can be transcribed into text.
This function is carried out by The Nuance® Dragon® Naturally Speaking software included in the SNFR product.
A typical report from a hop analysis showing the user’s transcribed narration and the recorded aroma intensity from the joystick is shown in Table 9. This report is formatted as a comma-separated value (CSV) file suitable for direct importation into Microsoft® Excel® or other application software.
Table 9. Typical output report showing text transcribed from the audio narration and the corresponding aroma intensity data. Source: PerkinElmer Food Safety and Quality
| . |
. |
| Project Name |
OKTOBERFEST.PRO |
| Sample Name |
019-HallertauDry |
| Time Stamp |
Spoken text |
Intensity |
| 1.05 |
coming up on a minute |
0 |
| 2.13 |
two minutes |
0 |
| 5.15 |
a sweet smell |
0 |
| 5.20 |
very faint |
0 |
| 6.07 |
nothing there |
0 |
| 6.65 |
very very faint smell |
2 |
| 6.88 |
off order |
3 |
| 7.12 |
like sour milk |
2 |
| 7.25 |
sour milk |
4 |
| 7.30 |
was a very good banana smell |
5 |
| 7.35 |
fruity smell |
4 |
| 8.18 |
like a sour milk |
4 |
| 8.23 |
sour milk |
4 |
| 9.17 |
fruit there |
2 |
| 10.02 |
nothing there |
0 |
| 10.10 |
large peak and I smell nothing |
0 |
| 11.52 |
burning smell |
2 |
| 11.58 |
almost woody |
0 |
| 12.00 |
little sweet |
1 |
| 12.45 |
almost a hint of coffee |
0 |
| 13.22 |
that’s an off smell |
3 |
| 13.25 |
a rancid smell |
3 |
| 13.82 |
something |
3 |
| 13.88 |
almost |
0 |
| 13.90 |
medical |
0 |
| 15.43 |
medical smell |
2 |
| 15.47 |
is almost toffee like |
2 |
| 15.57 |
very pleasing |
4 |
| 16.43 |
off order |
0 |
| 17.92 |
slight sweet |
0 |
| 18.58 |
bubblegum |
0 |
| 19.88 |
hint of something sweet |
0 |
| 21.00 |
off order of skunk |
3 |
| 21.08 |
definite skunk |
5 |
| 22.90 |
something |
3 |
| . |
. |
| Start Time |
9/19/2013 2:39:02 PM |
| Duration |
60.00 |
| Time Stamp |
Spoken text |
Intensity |
| 23.02 |
almost like a match |
1 |
| 23.07 |
a sulfur smell |
0 |
| 25.18 |
subtle |
2 |
| 25.22 |
subtle |
0 |
| 25.33 |
not quite sure what that was |
0 |
| 25.70 |
nothing there |
0 |
| 30.70 |
little off odor |
1 |
| 33.67 |
foul smell |
2 |
| 36.23 |
smell of cardboard must |
0 |
| 36.35 |
bananas |
2 |
| 36.82 |
almost mint |
2 |
| 38.08 |
that was a nice fruit |
3 |
| 38.20 |
very citrus |
0 |
| 42.47 |
hot |
4 |
| 42.50 |
pepper |
2 |
| 42.70 |
again |
3 |
| 42.82 |
it's an off odor |
6 |
| 42.85 |
are very bad off order |
6 |
| 43.08 |
a sweaty socks smell |
6 |
| 43.72 |
that's a fruity smell |
2 |
| 43.73 |
very pleasing |
2 |
| 45.78 |
floral |
2 |
| 46.30 |
a burning smell |
2 |
| 46.37 |
burning match almost |
2 |
| 47.02 |
pepper smell |
1 |
| 47.95 |
pepper |
1 |
| 48.93 |
sweet |
1 |
| 49.13 |
a sweet smell |
3 |
| 49.88 |
interesting smell |
1 |
| 49.92 |
can't describe it |
0 |
| 50.32 |
ah |
3 |
| 50.35 |
medical smell again |
4 |
| 50.40 |
medicinal |
4 |
| 54.08 |
solvent |
1 |
Conclusions
The addition of an olfactory port to a HS GC/MS system extends its application for aroma characterization of samples like hops. The ability to directly correlate organoleptic perception against hard analytical data supplies insights which would be challenging to obtain otherwise.
This system should be of interest to brewers and researchers involved in the following:
- Aroma analysis of finished beer
- Storage/aging studies
- Quality control of raw hops
- Product development
- Troubleshooting of off-flavors
- Reverse engineering of competitive products
- Comparison studies

This information has been sourced, reviewed and adapted from materials provided by PerkinElmer Food Safety and Quality.
For more information on this source, please visit PerkinElmer Food Safety and Quality.