Geological materials matrix composition and the complex sample preparation process required to convert these samples into solution pose a number of analytical challenges.
Approaches to sample preparation tend to differ between sample types and elements of interest, though lithium fusion remains one of the most commonly used sample preparation techniques for geological samples.
The fusion process involves the sample being mixed with excess lithium borate prior to this being heated. Heating continues until the lithium borate melts and dissolves the sample, eventually forming a homogenous mass. This solid is then dissolved in acid to enable analysis.
Fusion samples contain high concentrations of Group I elements, such as lithium (Li), sodium (Na) and potassium (K). This makes them some of the most challenging and punishing samples for an ICP-OES sample introduction system.
High salt concentrations resulting from the fusion preparation process may lead to deposits forming on the nebulizer and injector, potentially causing signal drift.
Significant concentrations of Group I elements may also lead to the rapid devitrification of the quartz torch, making it difficult to acquire accurate, precise results over longer time intervals.
These challenges can be overcome by utilizing the optimal selection of sample introduction components.
This article details the analysis of fusion samples using the PerkinElmer Avio® 550 Max fully simultaneous ICP-OES, focussing on the instrument’s long-term stability.
Experimental
Samples
Ore samples were prepared using a standard lithium metaborate fusion procedure. These samples featured high levels of calcium oxide, silicon dioxide, magnesium oxide, aluminum oxide and manganese (Mn).
Once fusion was complete, the resultant mass was dissolved in 5% nitric acid (v/v) to facilitate analysis. The samples’ dissolved solid content was 3.5 weight percent.
Measurements were performed and evaluated against the calibration curves of two known in-house reference materials. These reference materials had previously undergone lithium fusion sample preparation. To provide an internal standard, yttrium (Y) was added to all samples and standards.
Table 1. Avio 550 Ma x ICP-OES Conditions and Parameters. Source: PerkinElmer
| Component/Parameter |
Description/Value |
| Nebulizer |
SeaSpray™ |
| Argon Humidifier |
Elegra™ |
| Spray Chamber |
Twister baffled cyclonic |
| Torch |
D-Torch, ceramic |
| Injector |
1.2 mm id, tapered, alumina |
| RF Power |
1500 W |
| Torch Position |
-4.5 |
| Sample Uptake Rate |
0.7 mL/min |
| Read Time |
1 sec/analyte |
Instrumental Conditions
An Avio 550 Max ICP-OES (PerkinElmer Inc., Shelton, Connecticut, USA) was used to perform all analyses. Table 1 shows the instrument conditions and parameters used, while Table 2 shows the analytes and wavelengths.
Table 2. Analytes and Wavelengths. Source: PerkinElmer
| Element |
Wavelength (nm) |
Plasma View |
| Si |
251.612 |
Radial |
| Al |
308.211 |
Radial |
| Ca |
317.925 |
Radial |
| Mg |
285.212 |
Radial |
| Mn |
257.608 |
Radial |
| Y (internal Standard) |
371.029 |
Radial |
The samples’ high dissolved solid content meant that it was necessary to employ a SeaSpray™ nebulizer with an Elegra™ argon humidifier to minimize the risk of nebulizer clogging and deposit forming on the injector tip.
The SeaSpray™ nebulizer is extremely resistant to clogging, though the study opted to use the Elegra™ argon humidifier to further minimize any signal drift from matrix deposition on the injector and in the nebulizer.
Samples with a high dissolved solid content may also lead to deposits occurring on the torch, resulting in instability and devitrification. A ceramic torch was used to help alleviate devitrification, while the 1.2 mm injector helps to minimize plasma loading.
The high sensitivity afforded by the Avio 550 Max meant that introducing a reduced amount of sample to the plasma had no impact on the data quality.
Results and Discussion
The internal standard signal was monitored in all fusion samples over a 12.5- hour run to confirm the methodology’s stability. This was normalized to the first sample.
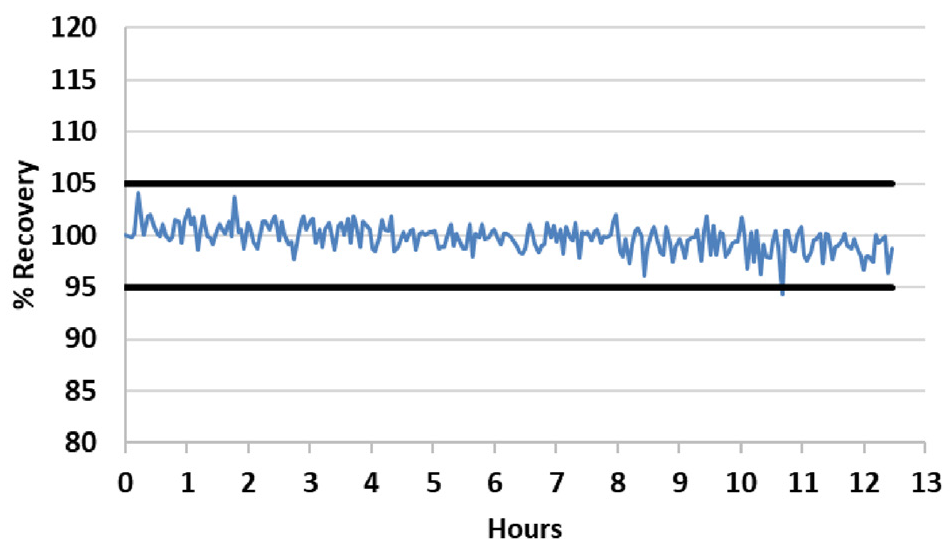
Figure 1. Internal standard stability over a 12.5-hour run of fusion samples. All results are normalized to the first sample. The black bars represent 95% and 105% recoveries. Image Credit: PerkinElmer
Figure 1 shows the resulting plot, highlighting the method’s exceptional stability. A total of 92% of the readings were found to be within 2% of the initial reading, with the other 8% of the recoveries within 5% of the initial reading.
The results displayed in Figure 1 highlight the outstanding long-term stability of the system, even when working with samples presenting significantly high total dissolved solids (TDS).
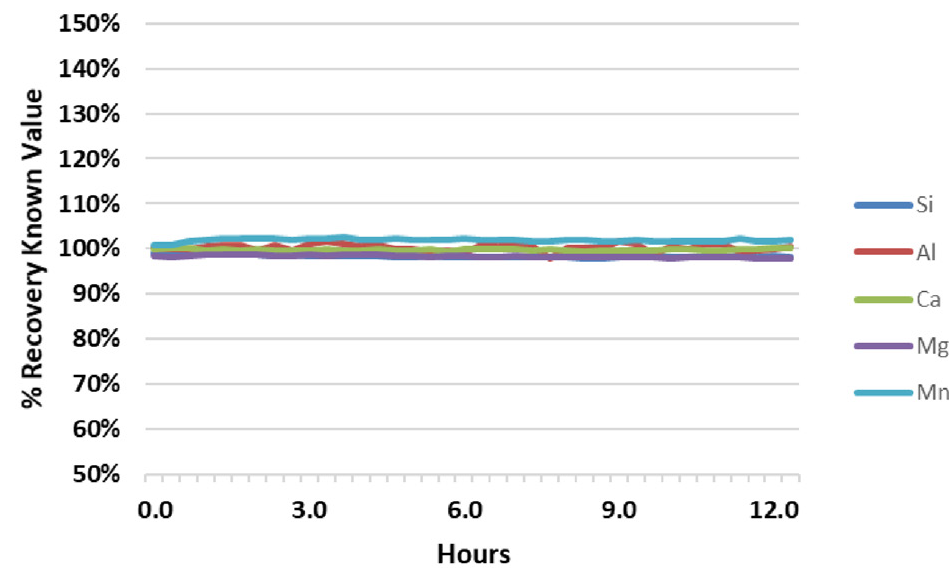
Figure 2. Analyte recovery in QC Standard 1 during a 12.5-hour analysis of fusion samples. Image Credit: PerkinElmer
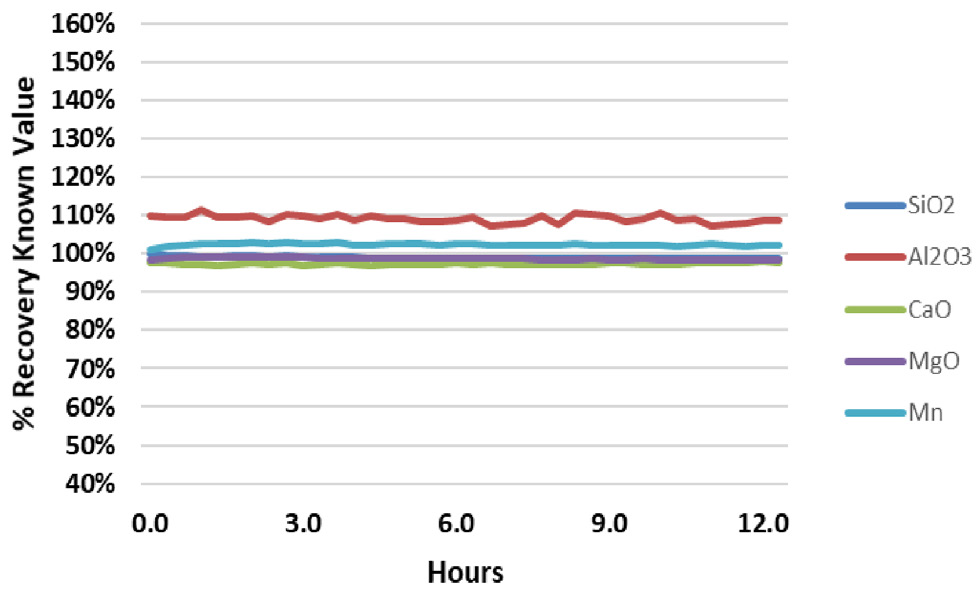
Figure 3. Analyte recovery in QC Standard 2 during a 12.5-hour analysis of fusion samples. Image Credit: PerkinElmer
The results for the two in-house QC samples from the same run were evaluated to further confirm the system’s stability (Figure 2 and Figure 3). These QC samples were analyzed every six samples throughout the analytical run.
QC standard recoveries were found to be within + 3% of their true value for all analytes, other than Al in QC Standard 2, which consistently recovers around 110%.
These results show that Al contamination is present in QC Standard 2, while demonstrating the excellent accuracy of the methodology.
Each figure includes relative standard deviations (RSDs) for the results over the 12.5-hour analysis period. RSDs are shown to be less than 1% for all elements, confirming that the samples’ high salt content does not impact system stability.
It was possible to analyze high TDS samples over a 12.5-hour period with no issues thanks to the robust combination of an Elegra™ argon humidifier, SeaSpray™ nebulizer, narrow bore injector, baffled cyclonic spray chamber and ceramic torch.
This combination of robust components enabled minimal salt deposition in the sample introduction system.
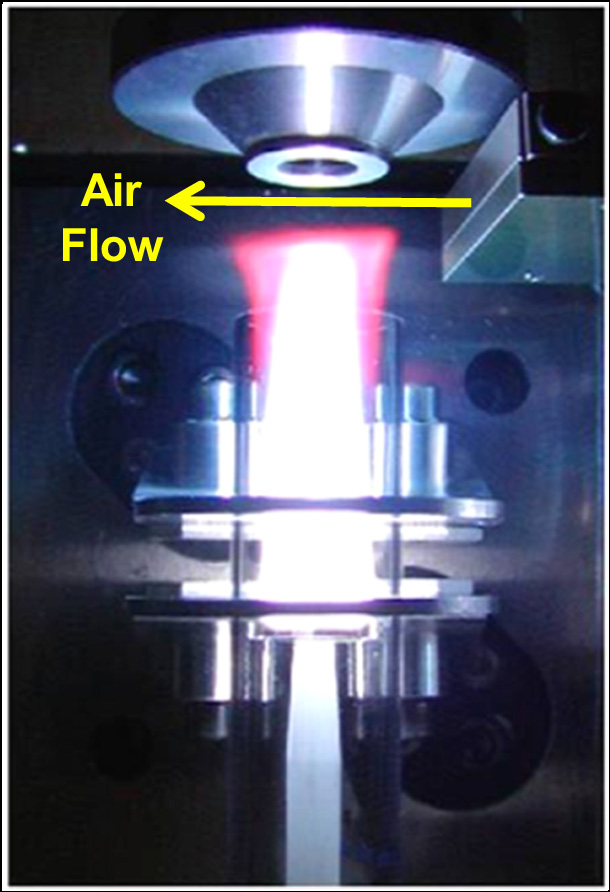
Figure 4. PlasmaShear technology in the Avio 550 Max ICP-OES cutting off the top of the plasma, preventing deposition on the interface window. Image Credit: PerkinElmer
Stability is further ensured via the Avio 550 Max's PlasmaShear™ technology. This innovative technology generates a thin stream of air that removes the topmost plasma (Figure 4), helping to avoid matrix deposition on the entrance to the spectrometer’s axial sampling window.
Measurements throughout this study were all performed in radial mode because deposition on the axial window had the potential to impact stability should matrix components become dislodged during analysis, causing these to fall into the torch.
Conclusion
The study presented here successfully demonstrates the capacity of the Avio 550 Max fully simultaneous ICP-OES to deliver accurate, reproducible results of fusion samples over extended time periods.
Fusion samples’ typically high TDS content can lead to issues during extended analyses, but the robust combination of Avio’s PlasmaShear system, an Elegra™ argon humidifier, SeaSpray™ nebulizer, narrow bore injector, baffled cyclonic spray chamber and ceramic torch was able to successfully inhibit the impact of high TDS.
Using the Avio 550 Max, it was possible to achieve accurate, stable results, even when analyzing challenging high-TDS samples.
Consumables Used
Table 3. Source: PerkinElmer
| Component |
Part Number |
Sample Uptake Tubing, Black/Black
(0.76 mm id), PVC |
N0777043 (flared)
09908587 (non-flared) |
| Drain Tubing, Red/Red (1.14 mm id), PVC |
09908585 |
| SeaSpray™ Nebulizer |
N0811307 |
| Elegra™ Argon Humidifier |
N0781598 |
| Ceramic D-Torch |
N0811912 |
| 1.2 mm Tapered Alumina Injector |
N0791181 |
| Autosampler Tubes |
B0193233 (15 mL, box of 500)
B0193234 (50 mL, box of 500) |
Acknowledgments
Produced from materials originally authored by Stan Smith from PerkinElmer., Inc.

This information has been sourced, reviewed and adapted from materials provided by PerkinElmer.
For more information on this source, please visit PerkinElmer.