Carbon nanomaterials, including graphene, graphite and carbon nanotubes (Figure 1), carry unique physical and thermal properties that make them key elements in industries as wide-ranging as battery manufacturing, construction and sports equipment.
As these materials are increasingly used in manufacturing settings, there is a growing need for straightforward, safe and comprehensive characterization methods. Raman spectroscopy is an invaluable tool for the characterization of carbon nanomaterials due to its speed, selectivity and capacity to nondestructively measure samples.
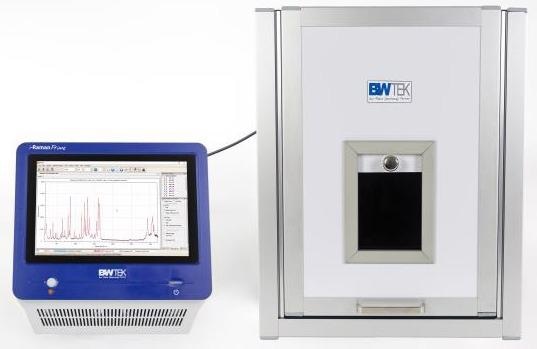
Image Credit: B&W Tek
Typically, Raman spectra of carbon materials are relatively simple, but they can also disclose a great deal of information about the internal microcrystalline structures based on peak positions, shape and relative intensity.
Raman spectra graphene-based materials can be characterized by three major peaks: the G-band, the D-band and the 2D-band. The G-band occurs at around 1580 cm-1 and constitutes the graphene in-plane bending motion of the sp2 hybridized carbon atoms. The G-band is extremely sharp in graphene showing high-quality attributes, signaling high crystallinity.
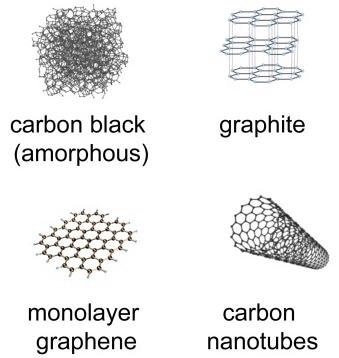
Figure 1. Structures of carbon allotropes. Image Credit: B&W Tek
The position of the G-band is also responsive to the number of graphene layers but is not influenced by the laser excitation. The D-band can be deemed to be a measure of disorder within a graphene sample.
The band represents a ring breathing mode for the sp2 hybridized carbon atoms. For the D-band to be detected in a spectrum of graphene, there must be either a fault in the graphene or the mode is nearing an edge.
In clean, unspoiled graphene, the D-band cannot be seen. The D-band demonstrates dispersive behavior, meaning that it demonstrates a sensitive response to the laser excitation used in the experiment. The 2D band is an overtone of the D-band, but contrary to the D-band, it does not need to be close to a defect for it to activate.
The peak shape of the 2D band can be utilized to identify the layer thickness. Like the D-band, the 2D band is also dispersive, so it will slightly change with a different laser excitation.
Experiment
An i-Raman® Prime 532H system (BWS475-532H-HT) was employed for each measurement of graphene-based materials. The system is comprised of 532 nm laser, which is the laser wavelength typically selected when conducting Raman measurements of carbon.
Table 1. Configuration for measuring carbon materials. Source: B&W Tek
| . |
. |
| System model |
i-Raman® Prime 532H |
| Laser wavelength |
532 nm |
| Accessories |
Probe holder BAC150B
Video microscope BAC151C-532 (optional)
E-grade probe upgrade for SWCNTs (optional) |
| Software |
BWSpec® |
The i-Raman Prime is a low-noise, high-signal throughput and fully incorporated Raman system with an integrated tablet computer. To support the fiber optic probe, a probe holder (BAC150B) was acquired for all measurements.
In order to make the otherwise class 3b laser safe for a manufacturing floor, an enclosure system (BAC152C) can be used to make it equivalent to a class 1 laser. The laser power typically used is ~34 mW, and acquisition times range from 30-90 seconds.
Raman Spectra of Carbon Nanomaterials
The D-band constitutes the degree of disorder across a graphene sample, while the G-band indicates the level of structural order. Hence, the ratio of the D and G-band intensities (ID / IG) calculated can be utilized as a semi-quantitative parameter for ascertaining the graphene sample’s quality.
The ID / IG within a sample increases in tandem with structural disorder. This ID / IG parameter typifies a quick quality-control parameter that can be employed as a Pass/Fail test in manufacturing settings.
The Raman spectra of some carbon nanomaterials are displayed in Figure 2. A spectrum of pristine graphene (red spectrum) only contains the G-band and the 2D-band; the D-band is not present. Additionally, the ratio of the intensity of the 2D band to the intensity of the G-band (I2D / IG) ≈2.
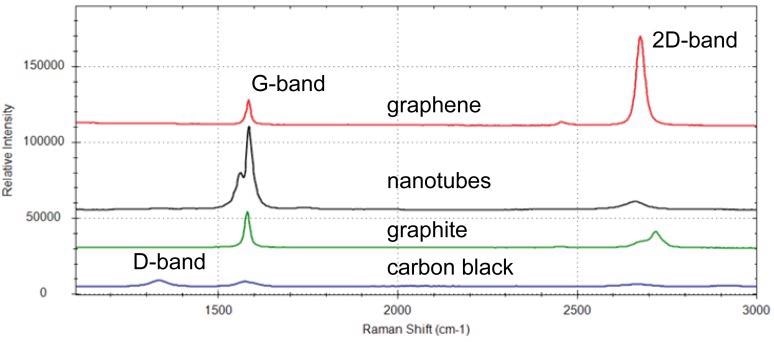
Figure 2. Raman spectra of graphene (red), carbon nanotubes (black), graphite (green), and carbon black (blue). Image Credit: B&W Tek
The spectrum of graphite (green spectrum) is distinguished by an enlarged and asymmetrical 2D band, and the I2D / IG is significantly lower. Spectra from carbon nanotubes (black spectrum), which are rolled up tubes of graphene, display a moderately split G-band.1
The G-band is divided into two degenerate modes (G+ and G-) by the curvature of single-walled carbon nanotubes (SWCNTs). Carbon black (blue spectrum), which possesses the slightest structural order, demonstrates a strong D-band, and therefore a high ID / IG.
It should be noted that if a laser different from the 532 nm laser is used for these measurements, the D-band and 2D band’s position will slightly change due to their dispersive nature.
Determination of ID / IG
Instructions for calculating ID / IG with Raman spectroscopy are detailed in ASTM E3220-20 Standard Guide for Characterization of Graphene Flakes.2 Spectra should be baseline corrected before identifying peak intensity.
For the spectra in Figure 3, a baseline removal algorithm was applied to the data in the BWSpec software. The peak intensities of the D-bands and G-bands of the spectra are calculated after baseline removal.
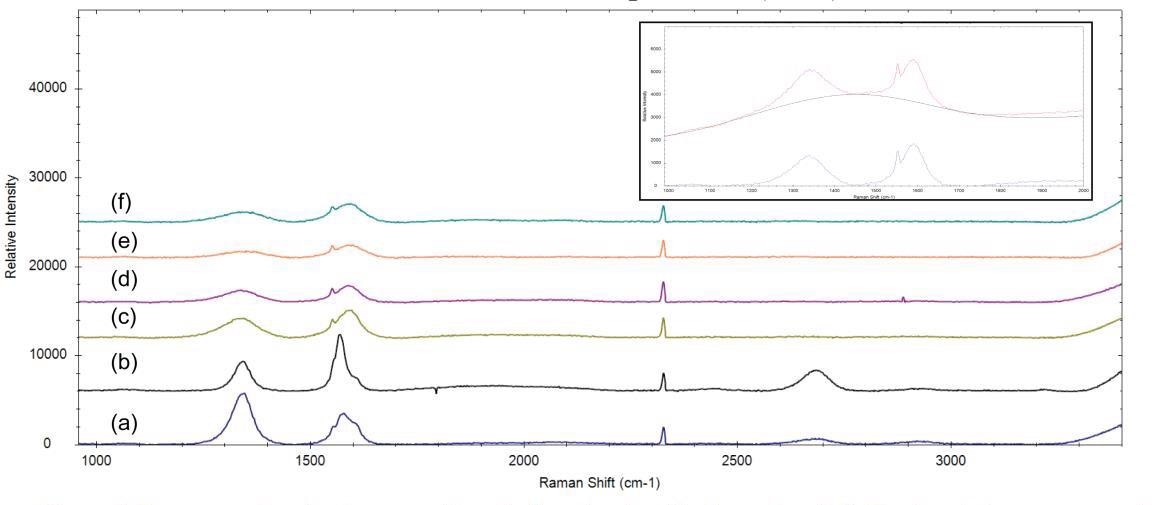
Figure 3. Raman spectra of carbon nanofibers (a,b) and carbon black powders (c-f). The insert shows an example of the baseline correction that was applied to all of the data. All spectra are manually offset for clarification. Note: sharp peaks at ~1550 cm-1 and ~2300 cm-1 are attributed to atmospheric oxygen and nitrogen, respectively. Image Credit: B&W Tek
Subsequently, the ID / IG can then be calculated. The BWSpec software can be programmed to report the ID / IG, and determine the ID / IG derived from a collected spectrum. For ease of reporting, the calculations can be exported to a table. Table 2 shows the type of table that the software generates.
Table 2. Measured ID, IG, and calculated ID / IG from BWSpec software. Source: B&W Tek
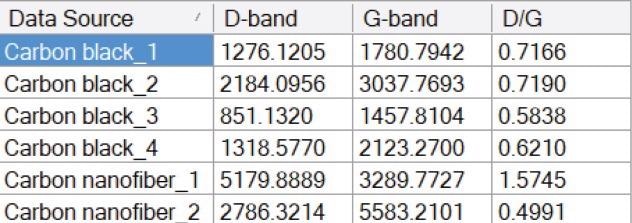
In Figure 3, the nanofiber spectra are marked by intense D-bands at around 1350 cm-1 and a number of asymmetries in the G-bands. The ID / IG of spectrum (a) is especially high, signaling that there is a considerable level of structural disorder within that nanofiber sample.
The spectra from the carbon black samples are determined by broad D-bands and G-bands, signaling extremely low crystallinity within the samples. The ID / IG measured for the carbon black samples are all above 0.5, signifying structural disorder through the structure of the sample.
This ID / IG can be employed as a rapid quality-control test of manufactured graphene, graphite, carbon black powder and carbon nanotubes, either as an offline or at-line measurement.
Conclusion
Raman spectroscopy has revealed itself to be an invaluable technique for the characterization of carbon nanomaterials. Carbon spectra are relatively basic and typically characterized by three peaks.
The peak intensities, shapes and positions disclose information about the sample’s internal crystallinity. The ratio of the intensity of the D-band to the intensity of the G-band serves as a plain indicator of the structural disorder of a sample. Researchers and manufacturers can use the ID / IG of a sample to characterize carbon nanomaterials.
References
- A. C. Ferrari. Solid State Communications. 143, 47–57 (2007).
- ASTM E3220-20, Standard Guide for Characterization of Graphene Flakes, ASTM International, West Conshohocken, PA, 2020, www.astm.org

This information has been sourced, reviewed and adapted from materials provided by B&W Tek.
For more information on this source, please visit B&W Tek.