Kandhasamy et al. recently published an article entitled “Operational strategies to improve the performance and long-term cyclability of intermediate temperature sodium-sulfur (IT-NaS) battery.”2
The article highlighted that while even the largest battery storage unit globally utilizes NaS batteries, this technology has not been widely embraced due to the need for extremely high-temperature operation at around 350 °C.
The authors also pointed out that while room temperature variants had been demonstrated in a laboratory setting, these devices are prone to cathode erosion and crystal formation on the anode, leading to decreased lifespan and loss of performance.
In order to address this issue, the team opted to investigate potential IT-NaS battery designs suitable for safe operation at 150 °C. Initial results seemed promising, but these also revealed a discharge capacity that was considerably less than the theoretical limit for both small and large cell configurations.
Further investigation showed that IT-NaS cell’s internal resistance showed a significant increase following a single charge and discharge cycle, indicating irreversible degradation to the electrolyte close to the cathode – an area referred to as the ‘catholyte.’
Raman bands correspond to the vibrational frequencies of molecular bonds, making this technique uniquely suited to the investigation of allotropes. The team, therefore, chose to employ an Avantes AvaRaman-532 TEC Raman spectrometer in measuring both the initial and reclaimed catholyte.
The acquired results (Figure 1) clearly showed an increase in the 175 cm-1 band, highlighting that the sulfur present in the battery was undergoing a chemical change.
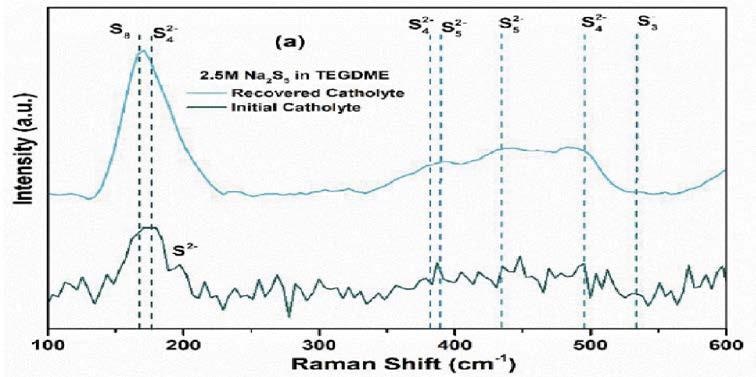
Figure 1. Raman spectrum of initial and recovered catholyte3. Image Credit: Avantes BV
Peak-fitting these spectra to existing and known S bands confirmed that this increase in peak height was due to an increase in insulating S8 and a decrease in active S4.
The degree of specificity required to make this demonstration confidently highlights the utility of Raman spectroscopy in terms of investigating allotropes.
Using Raman spectroscopy, it was possible to explore a range of different optimization strategies, including narrowing the catholyte layer and diluting the catholyte concentration.
The researchers were ultimately able to achieve improved long-term stability, performance, and a ground-breaking average total cell energy efficiency of 73 ± 4%.
System-Level Requirements for Raman Spectroscopy
The Raman signal expresses itself as a change in photon energy rather than a direct emission or absorption of photons. For this reason, there are a number of specific requirements for Raman excitation, detection and sampling.
The most significant requirement of any Raman system is ensuring that it utilizes an appropriate narrow-linewidth, wavelength-stabilized excitation laser. Raman spectra are always measured as a shift in frequency.
Figure 1 displays this as Raman Shift (cm-1), allowing clear observation of any red or blue shift in the laser wavelength, causing a subsequent peak shift in the Raman spectra.
If the laser linewidth is greater than the Raman band’s linewidth or the spectrometer’s spectral resolution, this will result in a ‘blurring’ of the observed spectra and reduced spectral resolution.
The AvaRaman-532 employs a highly stable 532 nm frequency-doubled Nd:YAG excitation laser that can achieve a linewidth of less than 0.1 nm.
This 0.1 nm linewidth at 532 nm corresponds to approximately 3.5 cm-1 - a value significantly less than the sp10 cm-1 resolution of the AvaRaman-532’s spectrometer - a deliberate design feature to avoid distortion of the Raman bands.
It is also important to note that the Raman effect arises from non-linear optical phenomena, meaning that the process is extremely weak at ~10-6 quantum efficiency.
Image Credit: Avantes BV
Accommodating this weakness necessitates the use of a tightly focused laser and long integration times. In order to facilitate the relatively long integration time required for Raman spectroscopy, every Avantes’ Raman spectrometer employs thermoelectrically (TE) cooled detectors.
The AvaRaman-532 TEC used in the study presented here also incorporates the AvaSpec-ULS2048L-TEC. This instrument is TE cooled to 5 °C and stable within 0.1 °C, ensuring a signal-to-noise ratio (SNR) of 200:1 when tested via the application of a benzene standard.
The AvaRaman-532 HERO-EVO is a newer model able to leverage the power of the AvaSpec-HERO to enable TE cooling down to -10 °C, offering users an outstanding SNR of 800:1 for benzene.
Advantages of the 532 nm Excitation Wavelength
The researchers decided to use the 532 nm wavelength for this application rather than the more common 785 nm excitation.
Two competing phenomena influence the choice of wavelength in Raman spectroscopy. One is the ‘omega to the fourth’ dependency. This phenomenon leads to increased scattering efficiencies at shorter wavelengths.
While this would suggest that shorter wavelengths are always a better option for Raman spectroscopy, this is not always the case due to the second of these phenomena: auto-fluorescence.
Fluorescence is generally regarded as a weak optical process, but it is still significant compared to Raman scattering, with auto-fluorescence often entirely masking the Raman spectrum.
The majority of organic molecules fluoresce when excited by visible and ultraviolet light, meaning that 785 nm laser excitation is generally preferred.
As the analyte of interest in this application was inorganic, there was minimal auto-fluorescence, and the researchers were able to make use of the increased Raman efficiency at 532 nm.
The ability to leverage this improved efficiency was central to the researchers’ success because the catholyte is highly absorbent, and this would have burned if subjected to the higher laser powers required by 785 nm excitation.
Avantes offers both 532 nm and 785 nm versions of its AvaRaman system for this reason, ensuring that researchers have the necessary flexibility for their application.
The ~175 cm-1 Raman band used to identify the presence of S8 in the catholyte is relatively close to the laser line.
It is important to note that most commercial Raman spectrometers feature a Raman shift cut-on at ~200 cm-1 due to standard optical filters’ difficulty filtering out any amplified spontaneous emissions from the laser source.
Avantes’ full range of Raman spectrometers - including the AvaRaman-532 - feature cutting-edge ultra-sharp edge filters and a proprietary optical design able to facilitate the measurement of Raman shifts down to 100 cm-1.
This makes the AvaRaman highly suited to measuring heavier atoms such as sulfur, which are known to vibrate at lower frequencies. Avantes also offers a range of modular and OEM Raman systems, including probes, laser sources and sample accessories.
References
- IEA (2020), Innovation in Batteries and Electricity Storage, IEA, Paris https://www.iea.org/reports/innovation-in-batteries-and-electricity-storage
- Kandhasamy, S., Nikiforidis, G., Jongerden, G.J., Jongerden, F., van de Sanden, M.C. and Tsampas, M.N., Operational strategies to improve the performance and long‐term cyclability of intermediate temperature sodium‐sulfur (IT‐NaS) battery. ChemElectroChem.
- Kandhasamy, S., Nikiforidis, G., Jongerden, G.J., Jongerden, F., van de Sanden, M.C. and Tsampas, M.N., Operational strategies to improve the performance and long‐term cyclability of intermediate temperature sodium‐sulfur (IT‐NaS) battery. ChemElectroChem. {Supporting Materials}

This information has been sourced, reviewed and adapted from materials provided by Avantes BV.
For more information on this source, please visit Avantes BV.