Sponsored by PerkinElmerReviewed by Olivia FrostSep 15 2022
Metal elements play a vital role in life on Earth and are an essential part of foods for humans and animals. Elements can either be introduced as contaminants during food processing or be taken up by crops and animals during growth from the air, water, soil, and food. Elements such as Cd, Hg, and Pb, are considered toxic, while some of these elements are essential macronutrients.
Humans are exposed to toxic elements through the consumption of contaminated food, with the risk increasing proportionately to the amount that is consumed. These toxic elements can have neurological-, endocrine- and exocrine-disrupting properties as well as be genotoxic and carcinogenic1 in some cases. Therefore, there is great concern about the contamination of food and water by toxic elements.
Sensitive and reliable analytical techniques are required for accurate measurement, as concentrations of toxic elements in foods are present at trace to ultra-trace levels.
ICP-MS is a powerful elemental analysis technique and has multi-element detection capabilities, low detection limits, high-speed analysis, and a wide linear dynamic range. However, it is susceptible to interferences as with any analytical technique, such as those arising in the plasma from the surrounding atmosphere, the plasma gases, and the matrix. This can result in the formation of polyatomic and doubly-charged ions.
The reaction of matrix ions and plasma-based elements, such as Ar, C, N, O, and H, generates polyatomic interferences, which can overlap target ions. There are several examples of polyatomic interferences relevant to the toxic-element analysis, including 40Ar35Cl+ on 75As+, 95Mo16O+ on 111Cd+, and 185W16O+ on 201Hg+.
The secondary ionization of elements with low second-ionization potentials forms doubly-charged ions, such as rare earth elements (REEs). One example is the doubly-charged ions from 150Nd and 150S, which may interfere with 75As and result in false overestimation.
With increased industrialization and globalization, food products can be sourced from geological regions with high REEs, even though rare earth elements are not usually present in significant amounts in food samples. Therefore, it is important that elemental analyses do not overlook certain rare earth elements present in some food products.
Equipped with Universal Cell Technology (UCT) that can run in Collision mode with kinetic energy discrimination (KED) as well as Reaction mode with dynamic bandpass tuning (DBT), PerkinElmer’s NexION® ICP-MS2 is highly suitable for analysis.
Colliding both the analytes and interferences is required in the Collision mode. This is carried out with an inert gas such as helium.
Polyatomic interferences undergo more collisions and lose energy as they have a larger cross-sectional diameter than elemental ions at the same mass (e.g., 95Mo16O+ is larger than 111Cd+), and cannot pass the energy barrier at the exit of the collision/reaction cell and are rejected from the ion beam.
Interferences from doubly-charged ions and isobars cannot be resolved effectively using Collision mode. There is a range of techniques that have been developed to correct these interferences, which can either be achieved through post-analysis mathematical corrections or the use of reaction gases. Mathematical corrections using the half-mass approach, i.e., correction equations at higher resolution, are often not preferred for doubly-charged ions, as this is achieved at the expense of analyte sensitivity.
Reaction gases are a more effective means of removing these interferences. In the case of As, it reacts with oxygen to form 75As16O+ at mass 91, so a move away of approximately +16 amu from the respective doubly charged interferents. The fact that this approach offers the lowest detection limit without compromising analyte sensitivity is another added benefit to this method.
The analysis of toxic elements in food samples using PerkinElmer’s ELAN® DRC II ICP-MS,2 which is a predecessor to the current NexION ICP-MS, has been described by The Association of Official Analytical Collaboration (AOAC) International elemental analytical method AOAC 2015.01. In this work, the NexION ICP-MS validated the analysis of toxic elements As, Cd, Hg, Pb, and Sb in various food matrices following AOAC 2015.01. Analysis of Sb was performed due to its regional relevance, despite the fact that it is not a target element in AOAC 2015.01.
Experimental
Instrumentation
A Titan MPS™ microwave digestion system (PerkinElmer Inc., Shelton, Connecticut, USA) was used to perform sample digestion. A NexION 2000 ICP-MS (PerkinElmer Inc.) equipped with a High Throughput System (HTS) and an S20 series autosampler was used to perform all analyses.
As the HTS uses flow injection technology to deliver the sample to the plasma during the data acquisition stage and diverts the sample to the waste for the rest of the time, the total sample load on the plasma is reduced, resulting in less maintenance and downtime.
HTS performs the wash procedure more efficiently than conventional sample introduction, as the sample loading and loop wash are enabled by the vacuum pump via Syngistix™ software. Table 1 displays the instrument components and operating conditions used for the analysis.
Table 1. NexION ICP-MS Instrument Components and Operating Conditions. Source: PerkinElmer
| Instrument Component |
Type/Value |
| Nebulizer |
ST-PFA MicroFlow |
| Spray chamber |
Quartz cyclonic |
| Torch |
One-piece quartz torch, 2 mm i.d. injector |
| Cones |
Nickel sampler and skimmer
Aluminum hyper-skimmer |
| Peristaltic Pump Tubing |
Carrier/internal standard: orange/green (0.38 mm i.d.)
Waste: gray/gray Santoprene (1.30 mm i.d.) |
| Sample Uptake Rate |
0.2 mL/min |
| Operating Conditions |
Type/Value |
| RF Power |
1600 W |
| Plasma Gas Flow |
15 L/minute |
| Auxiliary Gas Flow |
1.2 L/minute |
| Nebulizer Gas Flow |
Optimized for CeO+/Ce+ < 2.5%; Ce++/Ce < 2.5% |
| Cell Gas |
Oxygen, helium |
Instrument Optimization and Method Development
Table 2 lists the analyzed elements, their respective isotopes, and the mode of analysis used for each element in this method.
Table 2. Elements, Isotopes, and Mode of Analysis. Source: PerkinElmer
| Element |
Mass |
Mode |
| As |
91 |
Oxygen DRC |
| Cd |
111 |
Helium KED |
| Hg |
201 |
Helium KED |
| Sb |
121 |
Helium KED |
| Pb* |
206+207+208 |
Helium KED |
| Co** |
59 |
Helium KED |
| Mo** |
95 |
Helium KED |
| Zr** |
91 |
Helium KED |
| W** |
182 |
Helium KED |
| Lu*** |
175 |
Helium KED |
* Sum of three isotopes to address the natural abundance variation.
** Monitored elements
*** Element analyzed for digestion recovery evaluation.
Monitoring of Cobalt, Mo, Zr, and W took place for interference evaluation. The As element was measured as AsO in Reaction (DRC) mode using oxygen as the cell gas, while the rest of the analytes were measured in Collision (KED) mode using helium as the cell gas among the analytes.
Reagents and Calibration Standards
Throughout this work, ultrapure water (UPW; 18.2 MΩ.cm) and high-purity acids (Tamapure, Tama Chemicals, USA) were used.
By the dilution of ICP-MS grade multi-element standards, the calibration standards aided the mobility of Hg (see Consumables Used table) in a diluent made of 5% HNO3 spiked with 200 ppb of gold. This diluent was also used as the carrier solution and calibration blank.
Table 3 shows the concentrations of the calibration standards. As a continuing calibration verification (CCV) standard, standard 4 was also used.
Table 3. Concentrations of the Calibration Standards. Source: PerkinElmer
| Element |
Standard 1 (ppb) |
Standard 2 (ppb) |
Standard 3 (ppb) |
Standard 4 (ppb) |
Standard 5 (ppb) |
Standard 6 (ppb) |
| As, Cd, Sb, Pb, Lu |
0.01 |
0.1 |
1 |
10 |
25 |
100 |
| Hg |
0.001 |
0.01 |
0.1 |
1 |
2.5 |
10 |
A total of 40 ppb of Rh and Ir in a solution of 1% HNO3 and 4% isopropanol (IPA) made up the internal standard solution. This was then spiked with 200 ppb of gold. To compensate for the difference in the carbon content in the standards and samples, sopropanol was added. It was also added, among other samples, to address the carbon-induced signal enhancement effects on As. 3-4 The internal standard was placed into the designated port of the HTS valve and then mixed online with the sample. Where IPA was used to facilitate the washout of organic materials, wash solution consisted of 1.5% HCl (v/v), 1.5% HNO3 (v/v), and 5% IPA, and was spiked with 200 ppb gold.
Interference Removal Checking Solutions
Throughout this work, a series of single-element standard solutions of Co, Zr, Mo and W, which were prepared in 3% HNO3 with concentrations of 10, 50 and 100 ppb each, were used to evaluate the interference from 59Co16O2+ and 91Zr+ on 91AsO+, 95Mo16O+ on 111Cd+, and 185W16O+ on 201Hg+.
Sample Preparation
To validate the accuracy of the method, three food certified reference materials: SRM® 1568b (Rice Flour) and SRM® 2976 (Mussel Tissues) purchased from the National Institute of Science and Technology (NIST) (Gaithersburg, Maryland, USA), and DORM-5 (Fish Protein) purchased from National Research Council Canada (Ottawa, Ontario, Canada) were used.
To evaluate the method precision, they were also used (via method duplicates) and matrix spikes, in which the samples were spiked with multi-element standards to the concentrations of 1 ppb for As, Cd, Sb and Pb, and 0.1 for Hg in the analytical solutions.
Lu was added for all food samples prior to digestion to assess the potential loss during digestion, as is specified in AOAC 2015.01.
In each digestion batch, three method blanks were included. The blanks went through all the preparative steps and were treated the same as the samples.
By adding a few drops of ultrapure water (UPW), the digestion vessel was pre-wet.
Before being transferred into 75 mL microwave digestion vessels, food samples of ca. 0.5 g were accurately weighed. Following this, 1 mL of UPW was added, followed by 8 mL HNO3, 2 mL H2O2, and 0.1 mL of 100 mg/L Au and 100 mg/L Lu.
Using the built-in Rice Flour Method, the method blanks, samples, and matrix spikes were digested in the same batch. Table 4 shows the microwave digestion parameters.
Table 4. Microwave Digestion Parameters. Source: PerkinElmer
| Step |
Target Temperature (°C) |
Pressure (Bar) |
Ramp Time (min) |
Hold Time (min) |
Power (%) |
| 1 |
160 |
30 |
5 |
5 |
90 |
| 2 |
190 |
30 |
3 |
20 |
100 |
| 3 |
50 |
30 |
1 |
15 |
0 |
The samples were decanted into the pre-weighed centrifuge tubes after digestion. To obtain the intermediate sample solution, they were brought up to the 40 mL mark with UPW, after which weights were recorded.
An aliquot of the intermediate sample solution (10 mL) was pipetted into a pre-weighed 50 mL centrifuge tube, after which UPW was added to the 40 mL mark and the weights were recorded. This achieved a total dilution factor of ca. 320, and the samples were ready for ICP-MS analysis.
Results & Discussion
Evaluation of the Interference Mitigation/Removal
The background equivalent concentrations (BECs) of the target elements in the interference removal checking solutions evaluated the effectiveness of the interference mitigation/removal. Table 5 shows the results.
Table 5. Interferences Evaluation for the Target Elements. Source: PerkinElmer
| Element |
Concentration (ppb) |
Interfering Ions |
BEC of Interfered Analyte (ppb) |
| 91AsO+ |
201Hg+ |
111Cd+ |
| Zr |
10 |
91Zr+ |
DL |
|
|
|
| 50 |
DL |
|
|
|
| 100 |
0.0002 |
|
|
|
| Co |
10 |
59Co16O2+ |
|
0.001 |
|
|
| 50 |
|
0.002 |
|
|
| 100 |
|
0.003 |
|
|
| W |
10 |
185W16O |
|
|
0.003 |
|
| 50 |
|
|
0.010 |
|
| 100 |
|
|
0.025 |
|
| Mo |
10 |
95Mo16O+ |
|
|
|
0.002 |
| 50 |
|
|
|
0.006 |
| 100 |
|
|
|
0.013 |
The background is at ppt/sub-ppt levels with Zr and Co at concentrations up to 100 ppb for As, which is analyzed as AsO, and the background is ≤ 10 ppt for Hg and Cd with W and Mo at concentrations up to 50 ppb.
The concentrations tested for the interfering elements are much greater than anticipated in normal food materials in all cases. Nevertheless, in this study, the interfering elements were monitored to look out for extreme situations.
Lu Digestion Spike
For all digested samples, recoveries higher than 85% were achieved - including matrix spikes, blanks, and blank spikes, which meets the acceptance criteria (≥ 75%) as recommended in the AOAC Table 2015.01F.
Detection Limits and Background Equivalent Concentrations
To calculate the Limit of Quantification (LOQ), 10 times the standard deviation of 10 replicated measurements of the method blank multiplied by the dilution factor was used.
Figure 1 shows a comparison of the LOQs achieved in this work and those provided in AOAC 2015.011. The LOQs obtained in this work were lower than those of different food types published in the AOAC Table 2015.01H, for all the target elements.
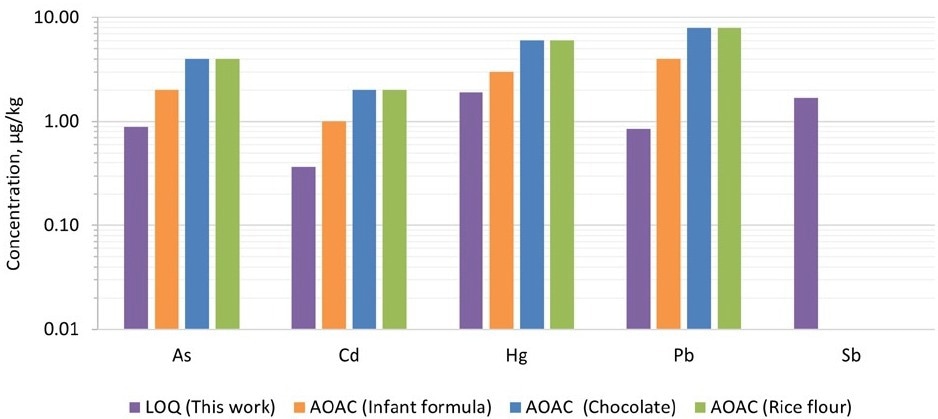
Figure 1. Comparison of limits of quantification (LOQs) achieved in this work with those captured in AOAC Table 2015.01H. Image Credit: PerkinElmer
Accuracy
Accuracy was verified by evaluating the recoveries of various analytes achieved for the SRMs, including NIST 1568b (Rice Flour), NIST 2976 (Mussel Tissues), and CRM DORM-5 (Fish Protein), and the matrix spikes.
The preparation of CRMs and matrix spikes occurred in duplicates and each preparation was measured three times. Figure 2 shows the mean recoveries of the duplicates. For the certified elements, recoveries between 85% and 114% were obtained, safely categorizing them within the QC criteria of 75-125% as provided in the AOAC Table 2015.01F.
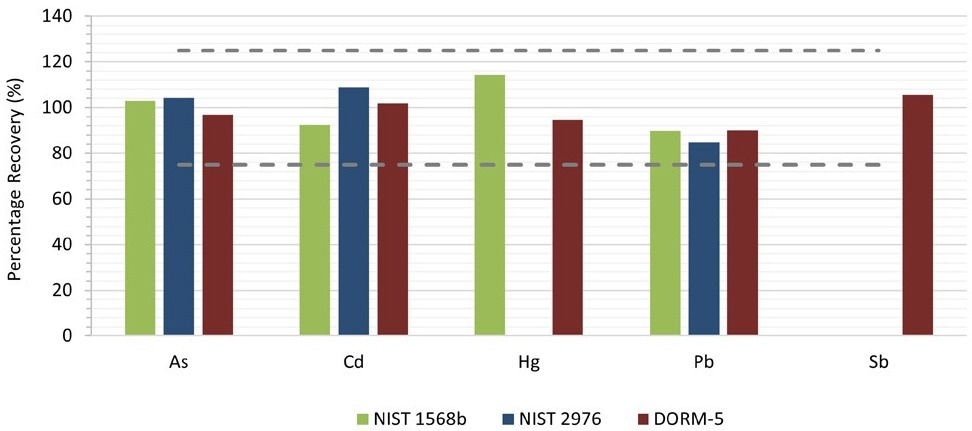
Figure 2. Recoveries for the certified elements in the CRMs. Image Credit: PerkinElmer
Three CRMs were used on which matrix spikes were performed. For each spiked sample, duplicates were prepared. Figure 3 shows the mean recoveries. For all target elements, recoveries between 75% and 113% were obtained for all target elements, meeting the QC acceptance criteria of 70-130% as specified in AOAC Table 2015.01F.
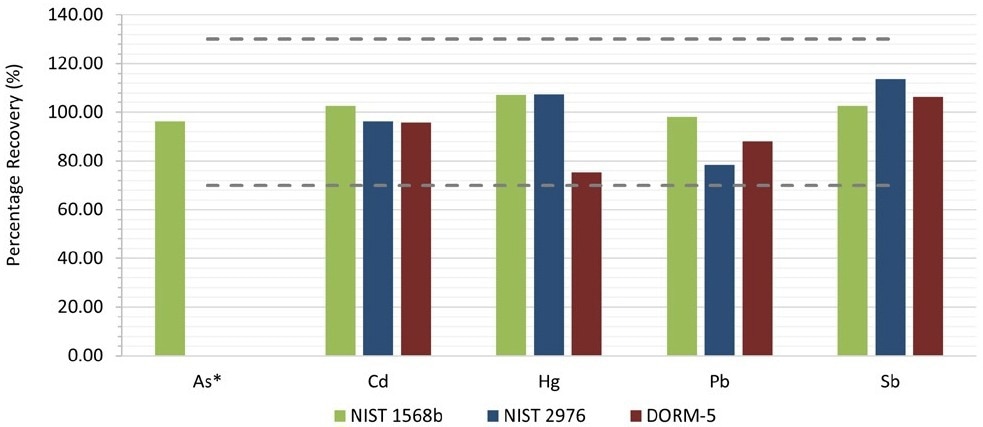
Figure 3. Spike recoveries for the tested CRMs. *The recoveries of As for NIST 2976 and DORM-5 were not reported. The spike level in this case was too low (<5% of the intrinsic amount), resulting in higher errors. Image Credit: PerkinElmer
Precision
The relative percent difference (RPD) of duplicated sample analysis evaluated the precision. The duplicated samples were separately digested and the samples ran through the same sample preparation process as individual samples. These tests were performed on three CRMs. As is shown in Table 6, the RPDs in all cases were within the QC acceptance criteria of < 30% as specified in the AOAC Table 2015.01F for all target elements.
Table 6. RPD Test Results on the CRMs*. Source: PerkinElmer
| Element |
NIST 1568b |
NIST 2976 |
DORM-5 |
Measured Conc.
(μg/kg)
Portion A |
Measured Conc.
(μg/kg)
Portion B |
RPD
(%) |
Measured Conc.
(μg/kg)
Portion A |
Measured Conc.
(μg/kg)
Portion B |
RPD
(%) |
Measured Conc.
(μg/kg)
Portion A |
Measured Conc.
(μg/kg)
Portion B |
RPD
(%) |
| As |
296.33 |
290.80 |
2 |
14035.8 |
13680.4 |
3 |
12884.6 |
12879.5 |
0.04 |
| Cd |
19.91 |
21.48 |
8 |
892.99 |
890.26 |
0.3 |
154.01 |
147.66 |
4 |
| Hg |
8.58 |
6.76 |
24 |
64.06 |
57.44 |
11 |
301.34 |
296.21 |
2 |
| Pb |
7.08 |
7.27 |
3 |
1055.0 |
963.99 |
9 |
50.68 |
53.77 |
6 |
| Sb |
< LOQ |
< LOQ |
- |
10.69 |
11.66 |
9 |
6.48 |
6.61 |
2 |
| Se |
383.02 |
375.03 |
2 |
2056.9 |
2005.2 |
3 |
2469.1 |
2464.8 |
0.2 |
* Portion A and Portion B were separately digested
Stability Check
Various food samples were measured repeatedly over eight hours to validate the stability of the method, and the CCV recoveries were also checked.
CCV was measured every 10-15 samples. As is shown in Table 3 and Figure 4, all CCV recoveries were normalized to Standard 4 and were well within ± 10% of the original reading, meeting the QC acceptance criteria of 85-115% as specified in AOAC Table 2015.01F.
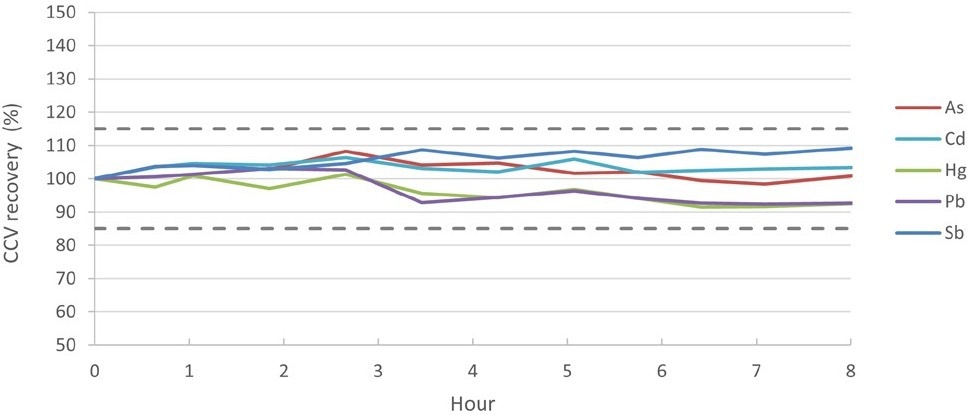
Figure 4. CCV recoveries over an 8-hour run of food samples. Image Credit: PerkinElmer
Conclusions
The NexION ICP-MS was used to validate the method outlined in AOAC 2015.01 for the analysis of toxic elements As, Cd, Hg, Pb, and Sb in various food matrices.
- A built-in method was used to digest the food samples using the Titan MPS microwave digestion system.
- To increase the sample throughput and reduce the total sample residence time in the plasma, flow injection with HTS was used for sample introduction.
- For the quantitation of target elements, the NexION 2000 ICP-MS was used. Versatile gas modes reduced or removed spectral interferences.
The work was evaluated for the limits of quantitation, accuracy, precision, and stability, following AOAC 2015.01. The suitability of the Titan MPS microwave digestion system and the NexION 2000 ICP-MS for this method and routine laboratory analysis was shown, and all the QC criteria were met and improved upon.
References
- Yiannis Fiamegos, Mitja Vahcic, Håkan Emteborg, James Snell, Georg Raber, Fernando Cordeiro, Piotr Robouch, Beatriz de la Calle; Determination of Toxic Trace Elements in Canned Vegetables. The Importance of Sample Preparation; Trends in Analytical Chemistry, 85, 57-66 (2016).
- AOAC Official Method 2015.01; Determination of Heavy Metals in Food by Inductively Coupled Plasma-Mass Spectrometry First Action 2015.
- Erik H. Larsen and Stefan Sturup; Carbon-enhanced Inductively Coupled Plasma Mass Spectrometric Detection of Arsenic and Selenium and Its Application to As Speciation; J. Anal. At. Spectrom., 9, 1099-1105 (1994).
- Tomoko Ariga, Yanbei Zhu and Kazumi Inagaki; Study on carbon-induced signal enhancement in inductively coupled plasma mass spectrometry: an approach from the spatial distribution of analyte intensities; J. Anal. At. Spectrom., 34, 1865-1874 (2019).
This information has been sourced, reviewed and adapted from materials provided by PerkinElmer.
For more information on this source, please visit PerkinElmer.