There has been a substantial increase in drug seizures in all major northern European ports, including Rotterdam, Anvers, Dunkerque, and Le Havre. These are now considered one of the main drug gateways into Europe.
In France, cocaine seizures, in particular, have risen. This is especially true in northern France, where, between 2020 and 2021, an unprecedented 26.5 tons of the drug were seized. Cocaine is an alkaloid chemically extracted from coca leaves; the resulting product is an illegal stimulant typically sold as a white crystalline powder.
Cocaine can be found in two forms: a water-soluble salt, typically injected or inhaled, and a water-insoluble free-base (crack), typically smoked. To bulk up the product, cocaine is often diluted (“cut”) with various pharmacologically active chemicals.
Additives are usually selected for their physical or chemical resemblance to cocaine, low cost, or additional physiological effects. The most frequently used additives are caffeine, hydroxyzine, lidocaine, levamisole, starch, phenacetin, and sugars such as mannitol, lactose, and glucose.
This article focuses on levamisole, an imidazothiazole predominantly used in veterinary medicine to deworm livestock. Over the past decade, its use as a cocaine-cutting agent has increased.
In police investigations, characterizing a cocaine sample involves two steps: identifying the sample’s chemical form and quantifying its purity.
Currently, fourier-transform infrared spectroscopy (FTIR) is being used in French forensic laboratories to identify the chemical form of cocaine before screening with GC-MS (gas chromatography mass spectrometry) and further quantitative analysis by GC-FID (gas chromatography flame ionization detection).
To ensure rapid analysis time and quick, effective policing, the Lille Forensic Police Laboratory, part of the Service National de Police Scientifique (SNPS) has developed a quantitative Raman spectroscopy method that can be combined with chemometric methods to establish the concentrations of cocaine and levamisole in various mixed powder samples.
Experimental
To develop the quantitative calibration model for levamisole and cocaine, 167 levamisole/cocaine samples from 38 different seizures and an analytical reference standard of uncut cocaine were used. GC-MS and GC-FID were previously used to analyze all samples.

Figure 1. Left) Nicolet iS50 FTIR Spectrometer with the iS50 Raman Accessory. Right) Available analysis templates. Image Credit: Thermo Fisher Scientific – Materials & Structural Analysis
Using an agate mortar and pestle, samples were ground to a homogeneous powder and then stored at room temperature before being analyzed. Data collection was then carried out using a Thermo Scientific™ Nicolet™ iS50 FTIR Spectrometer fitted with a calcium fluoride beam splitter and an FT-Raman module (containing a 1064 nm laser) (Figure 1).
In total, 60 scans were collected for each spectrum at 4 cm-1 resolution, with an overall acquisition time of approximately 70 seconds. The laser power was set at 450 mW. For each sample, two spectra were collected.
Samples were placed into a 48-well plate and then focused and analyzed automatically using Thermo Scientific Array Automation Software. The laser spot size is smaller than 60 microns, meaning that only a tiny quantity of the sample is required to perform the analysis.
Thermo Scientific™ OMNIC™ Software was utilized for instrument control, data acquisition, and data treatment.

Figure 2. Raman spectra of (A) cocaine hydrochloride salt, (B) cocaine base, and (C) levamisole hydrochloride salt. Image Credit: Thermo Fisher Scientific – Materials & Structural Analysis
First, spectra were compared to Thermo Scientific Raman libraries to establish the cocaine chemical form. Figure 2 illustrates the Raman spectra of each type of cocaine (hydrochloride salt and base). The spectrum of levamisole hydrochloride is also exhibited.
Individual partial least squares (PLS) models were then created for the quantitative analysis of cocaine and levamisole hydrochloride salts utilizing Thermo Scientific™ TQ Analyst™ Software.
PLS models employ a statistical approach that examines the selected region(s) of the standard spectra to identify which areas differ statistically as a function of component concentration.
Table 1. Cocaine and levamisole concentration ranges used for calibration development. Source: Thermo Fisher Scientific – Materials & Structural Analysis
| Components |
Low |
High |
| Cocaine |
23.1% |
100.0% |
| Levamisole |
0.0% |
68.0% |
To assemble each model, 232 spectra were used as calibration standards, and 104 spectra were used as validation standards. The concentration ranges of the components (quantified with the reference GC-FID method) are listed in Table 1.
To achieve consistency with the reference method, levamisole values will be reported from 2.0% to 68.0%. Both models utilize standard normal variate (SNV) pathlength treatments to alleviate the effects of spectral baseline shifting and intensity.
Results and Discussion
Both PLS models demonstrate low root mean square error of calibration (RMSEC) and excellent correlation to the reference method data. The correlation coefficient and RMSEC indicate how effectively the component concentrations of the calibration standards can be predicted using the calibration model.
Preferably, the correlation coefficient value should be close to one, and the RMSEC should approach the standard error of the reference technique (5%). The elements representing independent sources of variation from the concentration and spectral information are ranked according to the amount of variation in the data they illustrate.
Table 2. Summary of calibration results for PLS models. Source: Thermo Fisher Scientific – Materials & Structural Analysis
| PLS model |
Factors |
RMSEC |
Correlation coefficient |
RMSECV |
RMSEP |
| Cocaine |
4 |
2.09 |
0.9817 |
2.39 |
2.39 |
| Levamisole |
3 |
1.67 |
0.9903 |
1.89 |
2.14 |
Table 2 demonstrates how effectively the PLS models quantify levamisole and cocaine in powder mixtures.
In addition, comparing the root mean square error of prediction (RMSEP) to the RMSEC can indicate the model’s prediction accuracy of samples that are not within the calibration range. The RMSEP is calculated with an independent set of validation samples held back from the initial calibration.
Another method to check the robustness of the model is the root mean square error of cross validation (RMSECV). This diagnostic model can remove a set number of standards in sequence from the calibration set (for instance, ten standards were eliminated during each calibration), calibrate the method, and use the new calibration model to quantify the standards eliminated from the calibration set.
This process is repeated until all standards in the calibration set are quantified as validation standards. A suitable result for model accuracy is one where both the RMSECV and the RMSEP are lower than 1.5 times the RMSEC. This is the case for both PLS models discussed in this article.
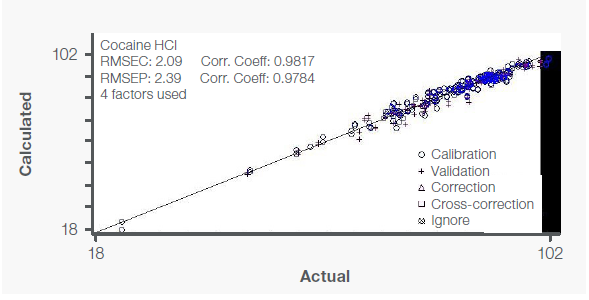
Figure 3. Calibration curve for cocaine with independent validation (+) samples. Image Credit: Thermo Fisher Scientific – Materials & Structural Analysis
The calibration curve for cocaine shown in Figure 3 exhibits an excellent correlation between the calculated (FT-Raman) and reference (GC-FID) values with a correlation coefficient of 0.982 and an RMSEC of 2.09.

Figure 4. Calibration curve for levamisole with independent validation (+) samples. Image Credit: Thermo Fisher Scientific – Materials & Structural Analysis
The calibration curve for levamisole in Figure 4 further illustrates an excellent correlation between the reference and calculated values with an RMSEC of 1.67 and a correlation coefficient of 0.990.

Figure 5. PRESS plot for cocaine PLS model. Image Credit: Thermo Fisher Scientific – Materials & Structural Analysis

Figure 6. PRESS plot for levamisole PLS model. Image Credit: Thermo Fisher Scientific – Materials & Structural Analysis
The predicted residual error sum of squares (PRESS) plots (Figures 5 and 6) rank the variation factors and display their associated variations. When an additional factor is introduced and represents useful information to the calibration model, there is a decrease in RMSECV and PRESS values.
To properly assess the accuracy of this new method against the reference method (GC-FID), 89 samples were analyzed using both methods concurrently.
For cocaine, all variations between results were less than 4.0%, and for 81.0% of the samples, deviations were as low as 2.0%. For levamisole, all variations between results were less than 2.6%, and for 96.6% of the samples, deviations were below 2.0%.
Conclusions
The Nicolet iS50 FTIR Spectrometer fitted with an iS50 Raman Accessory was employed in addition to proprietary software packages to deliver a novel solution that can determine a cocaine sample’s chemical form (hydrochloride salt or base) and quantify its cocaine and levamisole concentrations simultaneously.
This non-destructive method was effectively applied to quantify a hundred samples, delivering results comparable to those acquired by the laboratory reference method (GC-FID).
Sample preparation is easier and faster, making it the perfect solution for routinely identifying cocaine purity within police authorities’ short deadlines. This analytical method could be modified to detect other cocaine-cutting agents, including phenacetin or caffeine.
References
- UNODC, Cocaine - A spectrum of products, Cocaine Insights 2, UNODC, Vienna, October 2021
- Quantitative Analysis of Wheat Flour Using FT-NIR, Application note AN52269, Thermo Scientific

This information has been sourced, reviewed and adapted from materials provided by Thermo Fisher Scientific – Materials & Structural Analysis.
For more information on this source, please visit Thermo Fisher Scientific – Materials & Structural Analysis.