X-Ray diffraction (XRD) is a prevalent analytical technique in the industrial analysis of cement-based materials, playing a crucial role in the construction industry where cement is utilized to produce various products like concrete, mortar, and grout.
The quality and performance of these materials hinge upon the cement's crystalline structure and chemical composition.
As a non-destructive method, XRD yields essential insights into the crystallographic phases present in cement-based materials. This information empowers engineers and scientists to optimize the production process and enhance the performance of these materials.
This article offers an overview of the application of XRD in the industrial cement analysis of CEM I, with a specific focus on quantifying C3S M1 and M3 polymorphs. The article will be valuable for professionals engaged in the cement industry, including researchers, engineers, and quality control personnel.
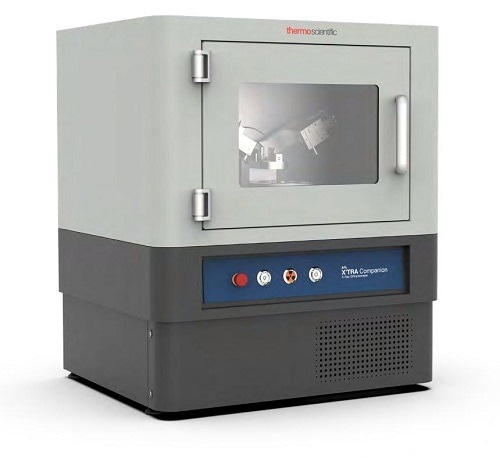
Figure 1. ARL X’TRA Companion diffraction system. Image Credit: Thermo Fisher Scientific - Elemental Analyzers and Phase Analyzers
Instrument
The instrument used for the XRD analysis is the Thermo Scientific™ ARL™ X’TRA Companion (Figure 1), a user-friendly benchtop XRD system suitable for process control and advanced applications. The ARL X’TRA Companion employs a θ/θ goniometer (160 mm radius) in Bragg-Brentano geometry, utilizing a 600 W X-Ray source (Cu or Co).
The beam's radial and axial collimation is regulated by divergence and Soller slits, while a variable beam knife minimizes air scattering. An optional integrated water chiller is available.
The ARL X’TRA Companion features a state-of-the-art solid-state pixel detector (55 x 55 µm pitch), ensuring rapid data collection. It has convenient one-click Rietveld quantification capabilities and automated result transmission to a LIMS.
Experimental
A CEM I powder sample underwent reflection measurements using the ARL X’TRA Companion with Cu Kα radiation (Ni filter) in the experimental setup.
The sample was measured in 11 repeats of five minutes each to assess reproducibility. Profex1 (BGMN algorithm) with a fundamental parameters approach was used for phase quantification, and reference structures were selected according to Aranda et al. (2012).2
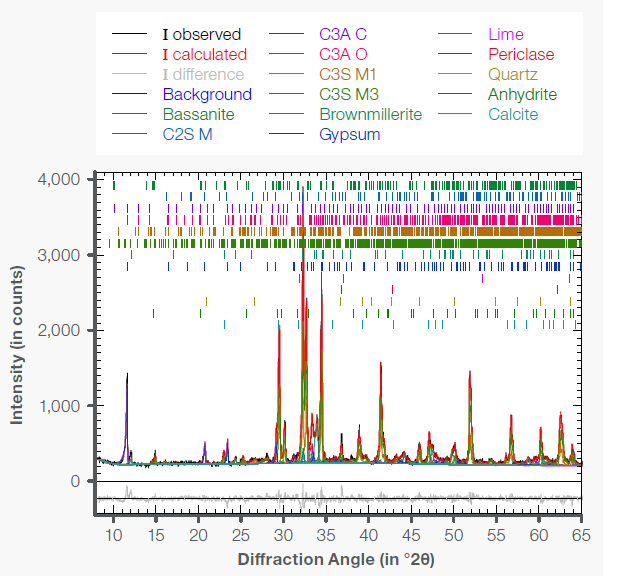
Figure 2. Rietveld fit of CEM I (5 min acquisition). Image Credit: Thermo Fisher Scientific - Elemental Analyzers and Phase Analyzers
Results
A CEM I sample underwent measurements (11 x 5 minutes; see Figure 2), followed by consecutive Rietveld refinements using a fundamental parameter approach. The data and refinement are of good quality, as evidenced by the standard deviations shown in Table 1. Notably, the sample does not contain any amorphous additives.
Quantifying C3S M1 and M3 modifications is feasible and yields a standard deviation of 1.2% (1σ; see Figure 3). The composition complies with the specifications outlined in ASTM C150 norm for OPC Type 1.
It is worth mentioning that C3S (73.5%) and C4AF (10.0%) contents are high, whereas C2S (2.2%) and C3A (6.4%) are relatively low. The sum of calcium sulfates also amounts to 6.3% (see Table 1). All values align with ASTM C150.
Conclusion
The ARL X’TRA Companion XRD system can efficiently collect OPC Type 1 data in just five minutes, enabling simultaneous quantification of C3S M1 and M3 alongside other crucial cement phases.
Utilizing a fundamental parameter approach, the one-click Rietveld refinement is a highly robust method with excellent reproducibility, delivering reliable outcomes even for C3S M1 and M3. Due to these exceptional qualities, the ARL X’TRA Companion is the optimal solution for process control tasks in the cement industry.
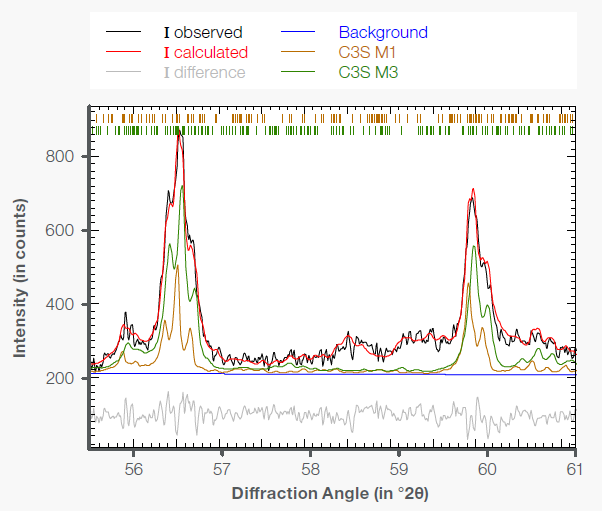
Figure 3. Zoom of CEM1 measurement (55-61° 2θ); Contribution of C3S M1 (brown) and C3S M3 (green) is shown and in good agreement with shape and intensity of the peaks. Image Credit: Thermo Fisher Scientific - Elemental Analyzers and Phase Analyzers
Table 1. Results of 11 consecutive refinements of CEM I (values in weight percent). Source: Thermo Fisher Scientific - Elemental Analyzers and Phase Analyzers
| |
Average values |
STDEV |
ASTM |
| |
(in %) |
(1 σ in %) |
C150 |
| C3S M1 |
22.64 |
1.17 |
|
| C3S M3 |
50.87 |
1.17 |
|
| C3S Total |
73.52 |
0.39 |
Min 52% |
| C4AF |
10.01 |
0.21 |
Max 10% |
| C2S β |
2.21 |
0.34 |
Max 28% |
| C3A Cubic |
1.85 |
0.50 |
|
| C3A Ortho |
4.52 |
0.51 |
|
| C3A Total |
6.37 |
0.24 |
Min 6% |
| Anhydrite |
0.34 |
0.10 |
|
| Bassanite |
0.30 |
0.22 |
|
| Gypsum |
5.69 |
0.35 |
|
| Sulphates Total |
6.32 |
0.33 |
Max 10% |
| Calcite |
0.47 |
0.20 |
|
| Lime |
0.24 |
0.10 |
Max 1% |
| Periclase |
0.19 |
0.05 |
|
| Quartz |
0.67 |
0.06 |
|
References
- N. Döbelin, R. Kleeberg, J. Appl. Crystallogr. 2015, 48, 1573-1580.
- M.A.G. Aranda, A.G. De la Torre, L. León-Reina, Rev. Mineral. Geochem. 2012, 74, 169-209.

This information has been sourced, reviewed and adapted from materials provided by Thermo Fisher Scientific - Elemental Analyzers and Phase Analyzers.
For more information on this source, please visit Thermo Fisher Scientific - Elemental Analyzers and Phase Analyzers.