The high energy density and long lifespan make lithium-ion batteries (LIBs) the power source of choice for a diverse array of portable devices.
Research continues to enhance battery performance through material innovations across the full range of battery components, with a particular focus on improving cathode and anode performance. For example, the development of new cathode-active materials primarily seeks to enhance energy density, power, and cycle life.
Cathodes manufactured from lithium nickel manganese cobalt oxides (NMC) have become a notable lower-cobalt alternative to lithium cobalt oxide, helping to address the ethical concerns around cobalt sourcing while reducing costs.
NMC cathodes follow the general formula LiNixMnyCozO2, and their performance can be tuned by adjusting the x:y:z ratios. Increasing the cathode’s nickel content raises energy density while simultaneously minimizing cobalt usage.
Common variants include:
- NMC 523 (50 % Ni, 20 % Mn, 30 % Co)
- NMC 622 (60 % Ni, 20 % Mn, 20 % Co)
- NMC 811 (80 % Ni, 10 % Mn, 10 % Co)
The development of these new materials emphasizes the need to enhance understanding of essential safety considerations.
Excessive heat, overcharging, or internal short circuits can trigger thermal runaway in LIBs. Material decompositions are largely exothermic, with the heat generated by these reactions further accelerating decomposition kinetics. This ultimately leads to the self-heating behavior observed at the early onset of thermal runaway.
Thermal runaway events are extremely energetic, releasing toxic gases, particulates, and heat. Safety evaluations and thermal stability assessments of potential LIBs often face delays until scaling to larger-format cells is achieved, but if the formulation is determined to be unstable, development must restart at the material level.
It is possible to reduce development time, lower risk, and build a more comprehensive understanding of cell stability and safety by conducting earlier phase investigations of LIB component material properties.
One notable and characteristic indicator of NMC decomposition is the release of oxygen gas. At higher temperatures, oxygen is shed from the lattice as NMC transitions from a layered metal oxide to a spinel or cubic rock-salt phase.1,2
It is therefore important to determine when, and if, oxygen and other gases evolve from LIB components to better understand battery safety and thermal stability.
An oxygen-generating decomposition pathway can cause combustion in an otherwise inert atmosphere. Responses to, and ultimately containment of, a battery fire will be fundamentally impacted by the amount of oxygen released during thermal degradation and the onset temperature.
Different NMC variants differ in their thermal stability. Thermal stability generally decreases with increasing nickel content, limiting the practical utility of NMC 811 despite its higher energy density.1
The SOC of NMC 811 also affects its safety profile. SOC influences the temperature at which thermal runaway begins.
Differential scanning calorimetry (DSC) has been used to evaluate electrodes at 0 %, 50 %, and 100 % SOC in previous studies.3 These studies revealed that the 100 % SOC NMC cathode experienced the earliest onset of thermal runaway, releasing the most energy through the full thermal ramp during cathode material degradation.
Lower SOC cells exhibit higher temperature onsets of exothermic runaway reactions, because they store less potential energy and, therefore, pose a reduced thermal hazard.
Thermogravimetric analysis (TGA) can be coupled with mass spectrometry (MS) in order to investigate how both SOC and NMC decomposition mechanisms impact the cathode’s thermal stability.
TGA is a fundamental tool for analyzing materials’ thermal stability as a function of temperature, time, and atmosphere. TGA typically measures weight loss during a heating ramp, capturing the onset of degradation, quantifying the total loss of degradation byproducts, and characterizing the relative thermal stability of different samples.
Combining a TGA with evolved gas analysis (EGA) enables the further study of degradation byproducts from a TGA experiment. Off-gassed degradation byproducts can also be analyzed by coupling a TGA instrument with a gas-phase spectrographic technique, for example, MS.4
It is possible to directly measure combustion byproducts such as water, carbon dioxide, and oxygen in real-time as they are emitted from the sample during the TGA experiment. It is also possible to directly compare and correlate the appearance and abundance of these gases to the weight loss observed during thermal degradation.
This technique has clear value but remains relatively uncommon for battery materials due to the need to run a TGA sample in an open pan within the instrument and the materials’ sensitivity to ambient conditions.
This limitation had previously necessitated placing the entire TGA in a glovebox to maintain sample integrity. This, however, meant that a user could not work in the glovebox for the duration of the measurement, as shifts in glovebox pressure could affect the apparent weight signal. TGA testing of battery materials usually requires a dedicated glovebox because the instrument is large.
In a recent experiment, the TA Instruments TGA Smart-Seal Pan was used to maintain inert conditions on the benchtop for NMC 811 at different states of charge.
This involved connecting a benchtop quadrupole MS to the gas outlet of a Discovery TGA (Figure 1) in order to directly and continuously monitor evolved mass fragments throughout a TGA-MS experiment.
This afforded the researchers useful insights into decomposition behavior, helping to inform safer battery design by improving understanding of material breakdown.
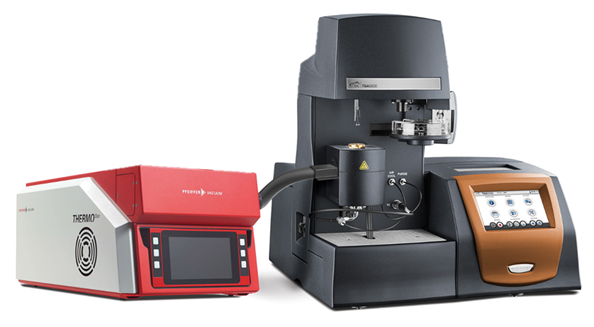
Figure 1. Discovery TGA™ 5500 connected to the Thermostar™ Mass Spectrometer. Image Credit: TA Instruments
Experimental
NEI Corporation prepared a series of powdered NMC 811 cathode samples, and batteries featuring different SOC were torn down, and the electrodes were washed with dimethyl carbonate (DMC) to remove electrolyte.
Next, the cathode material was removed from the current collector. This experiment used dry cathode powder harvested from batteries at 0 %, 50 %, and 100 % state of charge, identified as 0-SOC, 50-SOC, and 100-SOC, respectively.
The dried NMC 811 was sealed in glass vials. This was done under in dry, inert atmosphere before being stored in a nitrogen-purged glovebox until TGA pan preparation.
TGA sample preparation was performed in a glovebox under nitrogen purge in all cases, with experiments conducted using TA Instruments TGA Smart-Seal Pans (Figure 2).
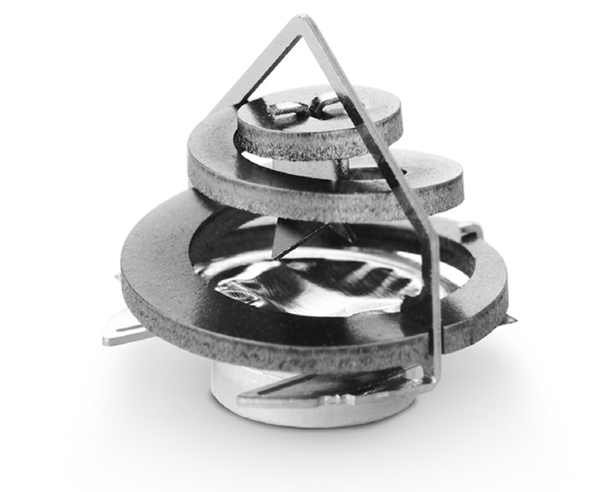
Figure 2. TGA Smart-Seal Pan. Image Credit: TA Instruments
TA Instruments TGA Smart-Seal Pans remove the need to run the entire TGA experiment within a glovebox, because they allow an atmospheric-sensitive sample to be run in a TGA while under an inert atmosphere.5
The System’s hermetically sealed pans prevent reactive atmosphere and moisture ingress, ensuring that the sample remains under inert conditions until the foil is pierced.
The TGA Smart-Seal Pan System’s bail features a cutter on a spring made of shape-memory alloy. The spring will actuate at approximately 55 °C, bringing the cutter down to pierce the foil and open the pan.
This design means that samples held within the TGA Smart-Seal Pan can maintain an inert atmosphere, because the pan remains sealed until after the TGA furnace has been closed and purged with inert gas.
Samples were weighed into TZero™ DSC pans and hermetically sealed with aluminum foil. This sealing was done using the pan crimping die designed for the TGA Smart-Seal Pan System.6
The sealed pans were removed from the glove box after samples had been added. These were then loaded into their corresponding bails within the TGA Smart-Seal Pan System before being placed on the TGA Autosampler for testing.
A Discovery TGA 5500 was used to perform thermogravimetric experiments, while a Thermostar Mass Spectrometer (Pfeiffer Vacuum GmbH) directly connected to the TGA at the gas outlet was used to perform off-gas analysis (Figure 1).
TGA Smart-Seal Pans were used to keep samples under inert conditions during testing in a standard ambient environment. This approach removes the need to place the TGA in a glovebox while testing atmospherically sensitive samples.
It is possible to integrate the MS control software and data output with the TA Instruments TRIOS™ Software to collect evolved gas data from thermal degradation or volatilization events, analyze it, and directly compare it with temperature and weight-loss data from the corresponding TGA experiments.
Every pan was loaded with 11 ± 0.5 mg of dry NMC 811 powder, and the same mass spectrometer bar graph recipe (1–50 AMU) was used to analyze the evolved gas from each TGA-MS experiment.
A dwell time of 64 ms yielded a total scan time of 3.3 seconds over the entire range. The Secondary Electron Multiplier (SEM) was used to measure mass fragments with added sensitivity. MS data collection was triggered at the beginning of each thermal ramp via a signal sent from the TRIOS Software.
The TGA experiment presented here was run under an argon atmosphere, with the balance and furnace purge rates maintained at 25 mL per minute throughout the experiment. Each sample was thermally ramped from room temperature to 600 °C at a rate of 20 °C per minute immediately after commencing MS data collection.
Results and Discussion
Figure 3 shows the TGA plots for NMC samples with different SOC. It was noted that the total weight loss following the thermal ramp of the cathode material increases with the increasing state of charge.
It was also observed that 100-SOC ended with 17.3 wt % loss, while 50-SOC and 0-SOC ended with 10.6 wt % and 5.9 wt % loss, respectively. It was also noted that 100-SOC exhibited an early weight loss step above 100 °C that had not been observed in the other samples.
The first onset of weight loss for 100-SOC is at 120 °C, while 50-SOC starts to show degradation at 236 °C. 0-SOC showed the highest thermal stability, with an initial weight-loss temperature of 252 °C.
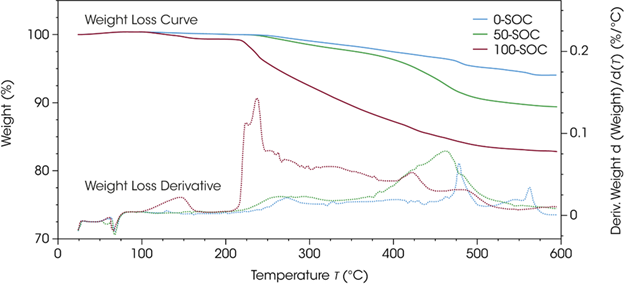
Figure 3. Weight loss curve (solid lines) and weight loss derivative (dotted lines) for NMC 811 at 0-SOC, 50-SOC, and 100-SOC, under an argon atmosphere. Image Credit: TA Instruments
The weight-loss derivative provides useful insight into the nature of thermal degradation. For instance, a monomodal weight-loss derivative peak could indicate a single degradation pathway, whereas less symmetrical derivative peaks or those with shoulders could suggest multiple weight-loss events and a more complex degradation pathway.
Such complex degradations may benefit from EGA analysis to identify reaction pathways.
Figure 4 overlays mass fragments’ ion-current signals corresponding to gases identified by MS during the TGA run. Evolved gas signals are plotted against temperature, along with the concurrently recorded TGA data.
The value for 100-SOC is shown to showcase the bulk of data, which can be observed in a single graph. It is possible to directly compare the weight-loss profile and its derivative (displayed as the black solid and dotted lines, respectively) with the gas-evolution temperature throughout thermal degradation in the same experiment.
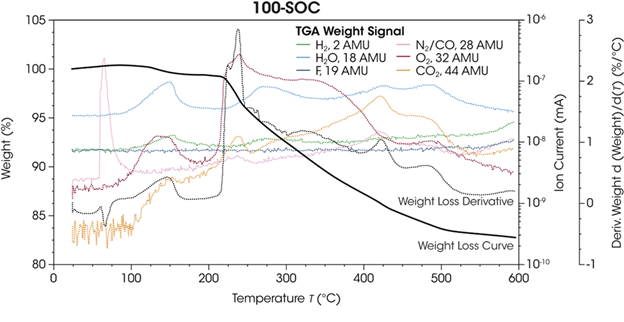
Figure 4. Weight loss and weight loss derivative for 100-SOC plotted against the signals for the observed mass fragments that evolved during the heating ramp. Image Credit: TA Instruments
Figure 4 plots significant mass fragment signals exhibiting changes throughout the TGA run. This includes signals corresponding to hydrogen (H2, 2 AMU), water (H2O, 18 AMU), fluoride (F, 19 AMU), nitrogen and carbon monoxide (N2/CO, 28 AMU), oxygen (O2, 32 AMU), and carbon dioxide (CO2, 44 AMU).
A significant peak was noted early in the experiment for the signal for mass-to-charge (m/z) 28 AMU. This could correspond to either nitrogen (N2) or carbon monoxide (CO).
It is also important to note that, although the TGA experiment was run under a constant argon purge, the samples were prepared in Smart-Seal pans and sealed in a nitrogen-purged glove box. This means that both nitrogen and carbon monoxide could have been detected at different points during the experiment, as observed in the 28 AMU signal.
The ion current signals for 28 AMU were plotted alongside those for 14 AMU to investigate this further (Figure 5). Another, typically weaker, nitrogen signal in MS can be observed at mass-to-charge 14 AMU.
Both 28 AMU and 14 AMU show large initial peaks for all samples, indicating nitrogen release from within the sealed TGA Smart-Seal Pans as the pan was opened by the actuating coil.
These results highlight the integrity of the TGA Smart-Seal Pans’ hermetic seal, ensuring that samples sensitive to the atmosphere remain under inert conditions. The pans were not opened by the bail of the TGA Smart-Seal Pan System until they were inside the closed TGA furnace and under an inert atmosphere.
No signal is observed for 14 AMU following the initial peak of released nitrogen, though 28 AMU continues to evolve throughout the thermal ramp. The m/z 28 AMU can be attributed to carbon monoxide above 100 °C.
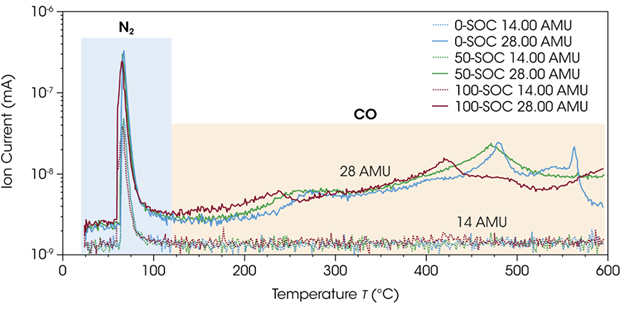
Figure 5. Ion current signals of m/z 14 AMU (nitrogen) and 28 AMU (nitrogen or carbon monoxide) for 0-SOC, 50-SOC, and 100-SOC during the entire TGA experiment. Image Credit: TA Instruments
It is possible to use the TGA-MS data presented in Figure 6 to compare NMC 811’s degradation pathways as a function of SOC. The production of a considerable amount of any gas in a battery cell or other sealed container represents a significant safety concern. The most pertinent gas to track from a flammability and safety perspective is oxygen, with an AMU of 32.
The ion current signals for oxygen (Figure 6E) most closely match the trends observed in the weight-loss derivative signals of the observed gases. This shows that oxygen loss from the NMC sample is a major factor in the observed weight loss over the entire thermal degradation.
The ion current signals for oxygen are stronger in 100-SOC samples, with an earlier temperature onset than in lower-state-of-charge samples. This potentially indicates that more oxygen is generated at lower temperatures, meaning that the fully charged NMC 811 is at the most risk of catastrophic failure.
The general trend in thermal stability is well correlated with SOC, with 100-SOC showing the least stable onset temperature for oxygen release and 0-SOC the most stable.
It was noted that 50-SOC exhibits a later derivative peak (~460 °C) than was seen in 100-SOC and 0-SOC, however. This peak corresponds to the strongest oxygen generation during the entire 50-SOC temperature ramp, which occurs at a far higher temperature than in either of the other samples. This suggests higher oxygen stability within the NMC lattice for 50-SOC relative to the fully discharged or charged samples.
A notable H2O peak appears slightly above 100 °C in 100-SOC (Figure 6B). This peak matches the initial weight loss event, which was not observed in samples with lower SOC.
Powders were dried, and a dry inert purge was maintained throughout sample preparation, experimental setup, and testing. Water is often generated as a combustion product during thermal degradation, but it should be noted that the strong water formation at the relatively low temperature of 100 °C in 100-SOC represents a critical safety consideration due to the reactivity of battery components to water.
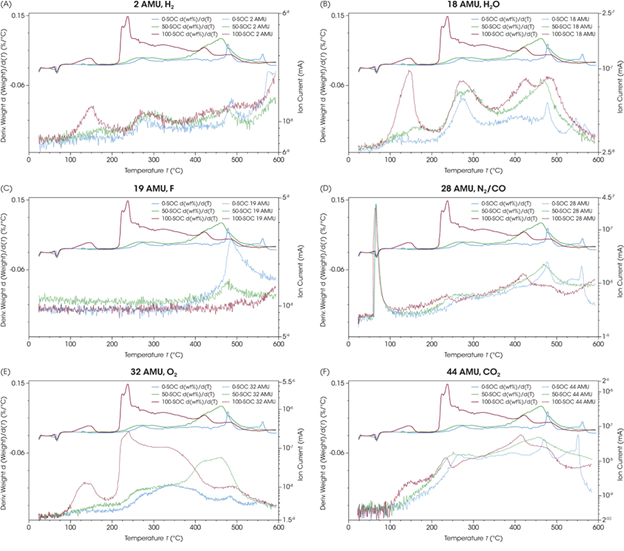
Figure 6. Weight loss derivative (top, shifted for clarity) and mass fragment signal (bottom, shifted for clarity) for 0-SOC, 50-SOC, and 100-SOC for (A) 2 AMU H2, (B) 18 AMU H2O, (C) 19 AMU F, (D) 28 AMU CO/N2, (E) 32 AMU O2, and (F) 44 AMU CO2. Image Credit: TA Instruments
Hydrogen evolution was observed throughout each sample’s thermal decomposition, including a notable early appearance of H2 in 100-SOC that was determined to coincide with significant water-related weight loss.
The H2 signal’s trend closely follows that of H2O for most of the temperature range of the experiment. This was the case across all three SOC levels, suggesting hydrogen generation in the same degradation reactions that created the observed H2O.
A sharp rise in H2 is observed above 550 °C; however, this does not match the trend in water. This could indicate the independent generation of hydrogen as a byproduct.
Following the initial release of nitrogen at 55 °C, the signals at m/z 28 AMU closely track those at m/z 44 AMU. The generation of CO2 and CO occurs simultaneously across all samples, in phase with one another, during cathode degradation. This corresponds to the decomposition of trace organic residue and carbon-based conductive additives. These components may undergo combustion despite the argon atmosphere, due to the sample’s O2 generation.
The ion current signal m/z 19 AMU is also observed in all samples, starting above 425 °C and displaying a peak at 500 °C for 0-SOC and 50-SOC. Mass-to-charge 19 AMU is generally recognized as a fluoride ion.
The signal was found to trend inversely with SOC, with 0-SOC being the largest and 100-SOC being the smallest. The appearance of fluoride during thermal runaway could be due to residual polyvinylidene fluoride (PVDF) binder within the samples, though further investigation is required to confirm this.
Conclusions
TGA-MS provides useful, early, materials-level insight into the thermal decomposition of LIB components. The proof-of-concept study presented here used NMC 811 at different states of charge to illustrate trends in relative thermal stability while monitoring safety-relevant degradation byproducts.
It was shown that the cathode’s thermal stability decreases as SOC increases, with 100-SOC powder losing more weight at lower temperatures and evolving relatively larger amounts of oxygen and hydrogen than partially discharged samples.
The production of these gases is a key reason why battery fires are especially difficult to extinguish.
The study presented here also demonstrated the usefulness of the new TGA Smart-Seal Pan, which was used to hermetically seal air-sensitive cathode powders prior to testing. This enabled accurate TGA-MS analysis on an instrument without a glove box.
The TGA Smart-Seal Pan was shown to significantly reduce the barrier to using TGA-MS on samples sensitive to the atmosphere, empowering more researchers to study degradation pathways, enabling key research to improve safety at the materials level, and supporting future thermal management.
Acknowledgments
Produced from materials originally authored by TA Instruments, Inc.
References
- Bak, S.-M., et al. (2014). Structural Changes and Thermal Stability of Charged LiNixMnyCozO2 Cathode Materials Studied by Combined In Situ Time-Resolved XRD and Mass Spectroscopy. ACS Applied Materials & Interfaces, 6(24), pp.22594–22601. DOI: 10.1021/am506712c. https://pubs.acs.org/doi/abs/10.1021/am506712c.
- Li, T., et al. (2019). Degradation Mechanisms and Mitigation Strategies of Nickel-Rich NMC-Based Lithium-Ion Batteries. Electrochemical Energy Reviews, 3(1), pp.43–80. DOI: 10.1007/s41918-019-00053-3. https://link.springer.com/article/10.1007/s41918-019-00053-3.
- TA Instruments. Safety Evaluation of Lithium-ion Battery Cathode and Anode Materials Using Differential Scanning Calorimetry. (online) Available at: https://www.tainstruments.com/applications-notes/safety-evaluation-of-lithium-ion-battery-cathode-and-anode-materials-using-differential-scanning-calorimetry/.
- Anon. Thermal Degradation Study of Nylon 66 using Hyphenation Techniques TGA-MS and TGA-FTIR-GC/MS. (online) Available at: https://www.tainstruments.com/applications-notes/thermal-degradation-study-of-nylon-66-using-hyphenation-techniques-tga-ms-and-tga-ftir-gc-ms/.
- TA Instruments - Materials Science Solutions. (2025). LiPF6 Studied With the New TA Instruments TGA Smart-Seal Pan. (online) Available at: https://www.tainstruments.com/applications-notes/lipf6-studied-with-the-new-ta-instruments-tga-smart-seal-pans-ta491/.
- TA Instruments - Materials Science Solutions. (2025). Introducing the TGA Smart-Seal™ Pan: A Self-Opening Thermogravimetric Sample Pan. (online) Available at: https://www.tainstruments.com/applications-notes/introducing-the-tga-smart-seal-pan-a-self-opening-thermogravimetric-sample-pan-tb104/.

This information has been sourced, reviewed and adapted from materials provided by TA Instruments.
For more information on this source, please visit TA Instruments.