Differential scanning calorimetry (DSC) is a widely recognized method used to investigate material interactions,1 particularly in energetic materials and a range of materials employed as pharmaceutical active pharmaceutical ingredients (APIs) and excipients.2,3
It is possible to use Modulated DSC™ Techniques to investigate these interactions via heat capacity changes. This method elucidates material interactions by simultaneously measuring two materials. When measured by DSC, the heat flow of two materials should equal the sum of their individual signals. The result will differ if there is an interaction between the materials.
These types of interactions must be quantified to determine critical outcomes, for example, the suitability of an excipient with an API or the energy released during an explosive detonation.
The use of DSC to quantify interactions has been extended to Quasi-Isothermal Modulated DSC (QI MDSC™), which allows changes in sample heat capacity to be studied as a function of time.
Heat capacity at a fixed temperature will remain constant if there is no interaction. If there is interaction, however, this will result in changes in molecular mobility and heat capacity.
Previous studies have shown that a mixture of crystalline sucrose and acetylsalicylic acid did not interact.2,3 This was compared to a mix of magnesium stearate and acetylsalicylic acid, which did show a clear interaction.
It was observed that changes in material morphology can affect stability,1 a key parameter for excipients.
This article looks at the use of these techniques to investigate acetylsalicylic acid, magnesium stearate, and sucrose, exploring the effects of material morphology via DSC and thermogravimetric analysis (TGA).
Experimental, Results, and Discussion
1. Material Interaction Testing
A TA Instruments™ Discovery™ DSC 25 was utilized in the measurement of acetylsalicylic acid, magnesium stearate, and sucrose samples in isolation and with 50:50 mixes of sucrose and magnesium stearate with the acetylsalicylic acid.
Acetylsalicylic acid was dry-mixed with magnesium stearate and sucrose by loading 40 mg of each into a small vial and stirring with a spatula. This mixture served as the sample for DSC characterization.
TZero™ Hermetic Pans were used to prepare samples of mass 5 mg before heating these from 25 °C to 170 °C at a rate of 1 °C per minute. The particle size of the sucrose was reduced prior to mixing due to the difference in particle size between the sucrose and the acetylsalicylic acid. This was achieved by using a small sample agate pestle and mortar to gently grind the sucrose.
A second set of tests examined the change in heat capacity of the mixed materials using QI MDSC Technique. This was done using an underlying isothermal temperature of 60 °C with a modulation period of 120 seconds and a temperature modulation amplitude of ± 2 °C.
The samples were maintained under these conditions for a total of 4 hours. The aspirin/magnesium stearate mix and the aspirin/sucrose (as supplied) mix were used in these tests.
Figure 1 features DSC thermograms for acetylsalicylic acid, magnesium stearate, and the 50:50 combination of the two. The thermogram shows a very different response, clearly highlighting an interaction between the two materials. Previously acquired data confirms that this result is expected.2
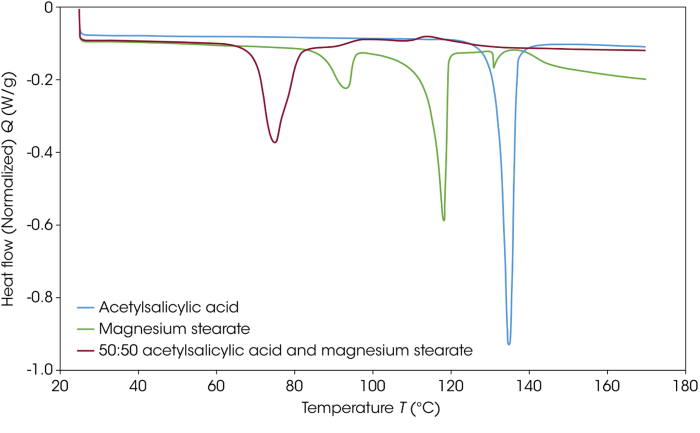
Figure 1. DSC thermograms of acetylsalicylic acid, magnesium stearate, and the 50:50 blend of the two materials. Image Credit: TA Instruments
Figure 2 features DSC thermograms for acetylsalicylic acid, sucrose, and the 50:50 combination of the two. This also appears to show an unexpected interaction in the mixed materials. In this instance, the particle size of sucrose was reduced to maximize the interaction potential.
This particle size reduction could have impacted sample morphology, potentially generating amorphous material and affecting the response.

Figure 2. DSC thermograms of acetylsalicylic acid, sucrose, and the 50:50 blend of the two materials. Image Credit: TA Instruments
A second mixture of acetylsalicylic acid and sucrose was prepared to test this effect, this time without reducing the size of the sucrose particles. Figure 3 features DSC thermograms for acetylsalicylic acid and the two acetylsalicylic acid-sucrose mixtures.
The acetylsalicylic acid and sucrose, as supplied, show no interaction with the temperature at which the loss of crystalline structure of the acetylsalicylic acid remains unaffected.
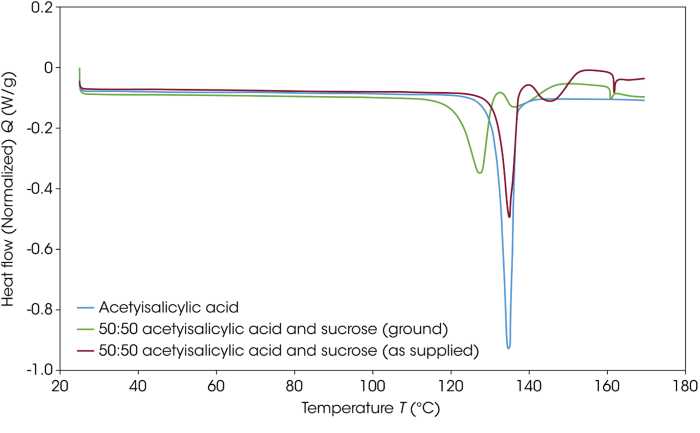
Figure 3. DSC thermograms of acetylsalicylic acid and the two acetylsalicylic acid sucrose blends. Image Credit: TA Instruments
The usefulness of the QI MDSC Technique was demonstrated in previous studies.2,3 An interaction in the materials would be shown by alterations in the reversing heat capacity as a function of time.
Figure 4 displays the heat flow and reversing heat capacity signals for the 50:50 acetylsalicylic acid: magnesium stearate mix. A small heat flow effect is observed here (about 8 μW/g), but there is a notable change in the heat capacity.
Figure 5 shows the same detail for the 50:50 acetylsalicylic acid:sucrose mixture. The mix in this instance contained the supplied sucrose, which showed no interaction in the ramp DSC data. The heat flow in this case varies by 0.8 μW/g, while the heat capacity change is negligible at 0.008 J/g°C.

Figure 4. QI MDSC Technique plot of 50:50 mix of acetylsalicylic acid and magnesium stearate. Image Credit: TA Instruments
Figure 6 serves as a visual comparison showing the overlay of the heat capacity signals for both mixes. This clearly highlights the difference between the blends.
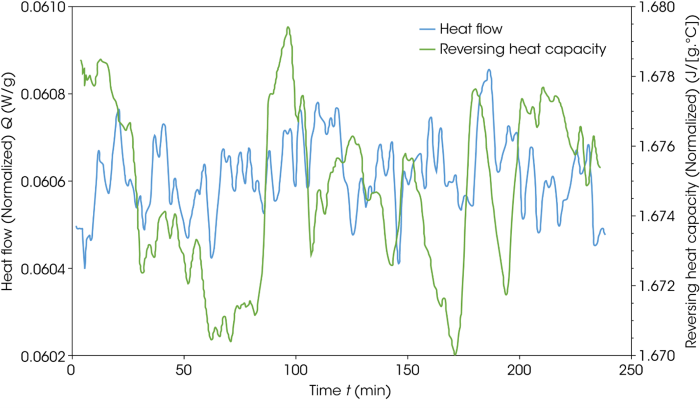
Figure 5. QI MDSC Technique plot of 50:50 mix of acetylsalicylic acid and sucrose (as supplied). Image Credit: TA Instruments

Figure 6. Reversing Heat Capacity signal from the QI MDSC Technique DSC plot of 50:50 mix of acetylsalicylic acid with magnesium stearate and sucrose (as supplied). Image Credit: TA Instruments
2. Studies of Sucrose in as-Supplied and Milled Forms
Testing of material interaction revealed a difference in the interaction between the acetylsalicylic acid and the sucrose in cases where the particle size was reduced.
A brief investigation into changes in the sucrose was also performed, with samples of sucrose, both as supplied and with reduced particle size, analyzed via DSC (DSC25) and TGA (Discovery TGA550).
Initial testing employed 5 mg of the sample in Tzero Hermetic Pans. These samples were heated from -20 °C to 230 °C at a rate of 10 °C per minute. Figure 7 features DSC thermograms for the sucrose as supplied and the sucrose with reduced particle size, highlighting a distinct difference in the temperature at which there is a loss of crystalline structure.
Looking at the baseline between 100 and 120 °C, the particle size reduced sample exhibits a small exotherm. This suggests a recrystallization of the amorphous material generated via the grinding process.
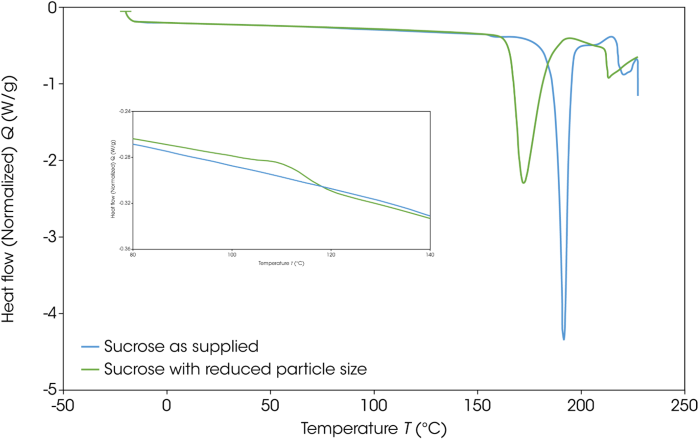
Figure 7. DSC thermograms of as-supplied and particle-size-reduced sucrose. Image Credit: TA Instruments
It is largely accepted that the endothermic transition observed in sucrose is triggered by the loss of crystalline structure, which is considered to be a decomposition rather than a true melting process.4,5
The onset temperature of the reduced-particle-size sample endotherm was observed at just over 150 °C, prompting a series of experiments incorporating isothermal holds at 130 °C to detect any observable decomposition.
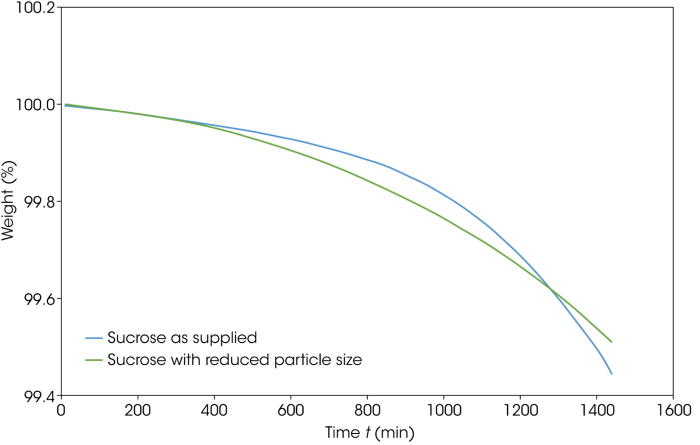
Figure 8. Isothermal TGA thermograms for the as-supplied and particle-size-reduced sucrose. Image Credit: TA Instruments
Initial experiments employed isothermal TGA for 24 hours to examine weight loss. This approach does not clearly define decomposition, but it does show the level of volatile loss.
Figure 8 features the TGA overlay of the as-supplied and particle-size-reduced sucrose held isothermally at 130 °C. The overall weight loss is less than 0.6 % in this case, but there is a notable difference in the rate of volatile release. There was a crossover at about 1300 minutes, but it was unclear if this was an experimental variation or a genuine effect.
A mixed aging/ramp DSC testing protocol was carried out following the TGA experiments. This was done based on a previously used protocol.5
This experiment heated the sucrose samples to 130 °C and held them for three hours. Next, the sample was cooled and reheated to the previous isothermal test temperature. This process was repeated in sequential steps to achieve a total isothermal aging time of 24 hours.
Isothermal aging was performed under modulated DSC conditions to ensure the change in heat capacity could be observed. The heating segments used to investigate the change in morphology were performed at a rate of 10 °C per minute.
Figure 9 displays the first ramp, prior to isothermal aging. It is possible to see the recrystallization in the particle size-reduced sucrose again, but no other clear transitions were observed.
Figure 10 illustrates the reversing heat capacity signals of the two sucrose samples during the isothermal holds at 130 °C. An increase in heat capacity over time is clear in both samples, potentially indicating a structural change. This change also occurs earlier in the particle-size-reduced material, suggesting a reduction in stability.
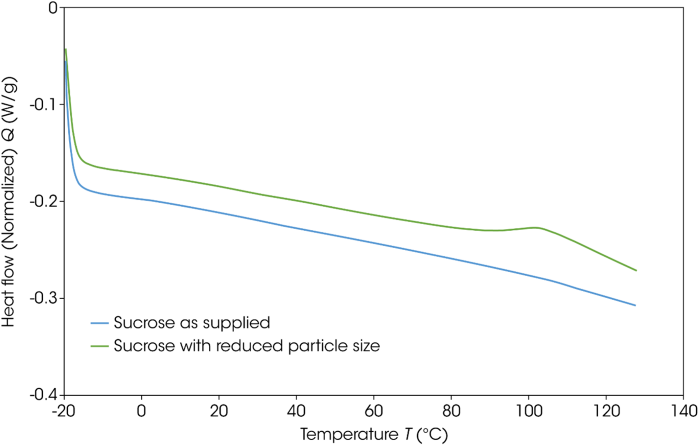
Figure 9. First heat data of the two sucrose samples prior to isothermal aging. Image Credit: TA Instruments
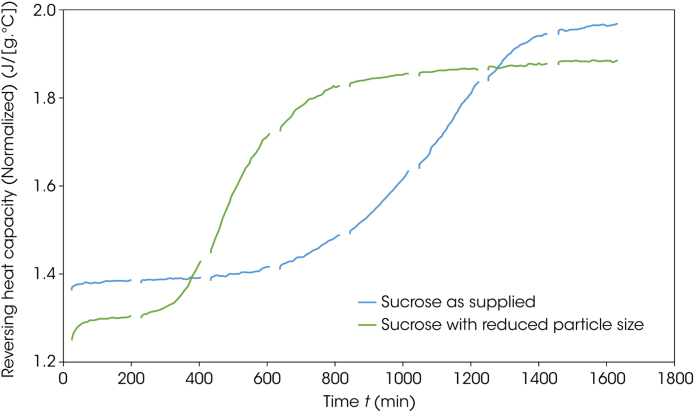
Figure 10. Change in the reversing heat capacity as a function of time during the isothermal aging steps at 130 °C. Image Credit: TA Instruments
Figures 11 and 12 feature the initial ramp data and the ramp data following each of the three-hour isothermal holds. The initial heat and the heat after three hours of aging do not show any significant structural change in either sample, except for recrystallization during the first heat of the particle-sized reduced sucrose.
The presence of a glass transition can be observed after six hours, however, highlighting the development of amorphous material. A general trend can be observed, whereby the glass transition decreases in temperature and increases in step height. This trend confirms a decomposition of the material alongside an increase in the degree of amorphous material.
Figure 13 highlights the change in the midpoint temperature (half height) while Figure 14 illustrates the delta Cp value (reflection of the degree of amorphous material) for both the as-supplied and particle size reduced sucrose samples. The data in both figures commences after six hours of aging because this is where the glass transition was first observed.
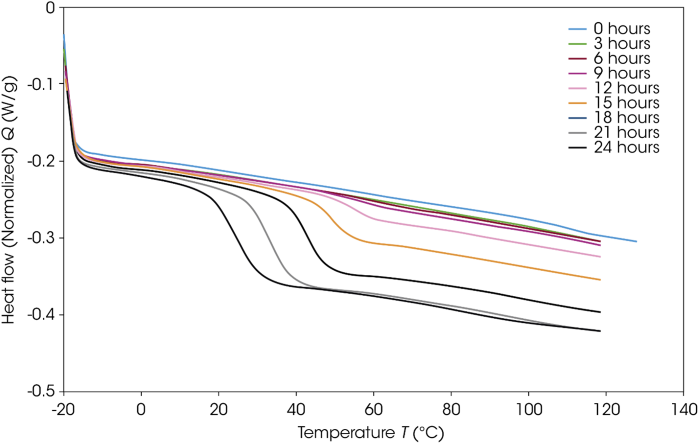
Figure 11. DSC ramp data for the as-supplied sucrose sample after each aging period at 130 °C. Image Credit: TA Instruments

Figure 12. DSC ramp data for the particle-size-reduced sucrose sample following each aging period at 130 °C. Image Credit: TA Instruments
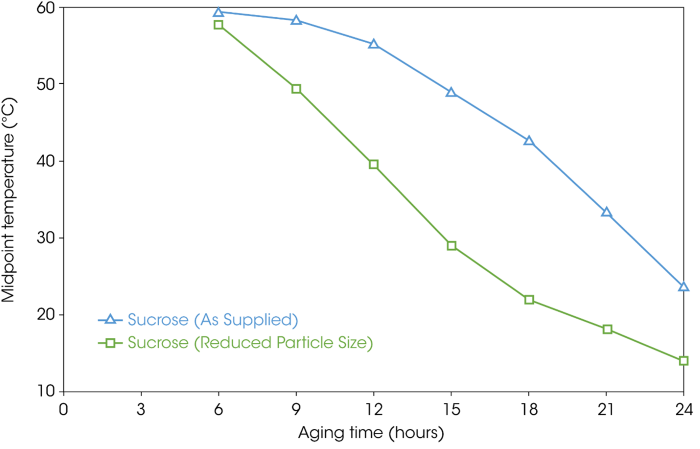
Figure 13. Change in glass transition temperature (midpoint as half height) for the as-supplied and reduced particle size sucrose samples. Image Credit: TA Instruments

Figure 14. Change in delta Cp values for the as supplied and reduced particle size sucrose samples. Image Credit: TA Instruments
Conclusions
This article revisited a range of historical data on the use of DSC and MDSC Techniques in investigating material interactions, noting the potential impact of material morphology. This work was then expanded to investigate the impact of morphology on the stability of the single material (sucrose).
References and Further Reading
- STANAG 4741:0 Chemical Compatibility of Ammunition Components with Explosives and Propellants (Non-Nuclear Application).Available at:European Defence Agency - EDSTAR
- Aubuchon, S. R. & Thomas, L. C. A New Approach to the Measurement of Drug-Excipient Incompatibility. Available at: https://www.tainstruments.com/pdf/literature/TA348%20A%20New%20Approach%20to%20the%20Measurement%20of%20Drug%20Excipient%20Incompatibility%20.pdf
- Len Thomas and Hang Kuen Lau. Drug -Excipient Incompatibility with Discovery X3. Available at: https://www.tainstruments.com/pdf/literature/TA442.pdf.
- Lee, J.W., Thomas, L.C. and Schmidt, S.J. (2011). Investigation of the Heating Rate Dependency Associated with the Loss of Crystalline Structure in Sucrose, Glucose, and Fructose Using a Thermal Analysis Approach (Part I). Journal of Agricultural and Food Chemistry, 59(2), pp.684–701. DOI: 10.1021/jf1042344. https://pubs.acs.org/doi/10.1021/jf1042344.
- Keller, S. (2025). DSC Characterization of Crystalline Structure in Foods and Pharmaceuticals: Apparent Melting (Part 2 of 3). (online) TA Instruments - Materials Science Solutions. Available at: https://www.tainstruments.com/dsc-characterization-of-crystalline-foods-pharmaceuticals-apparent-melting-part-2-of-3/.
Acknowledgments
Produced from materials originally authored by Philip Davies, Principal Applications Scientist at TA Instruments, Inc.

This information has been sourced, reviewed and adapted from materials provided by TA Instruments.
For more information on this source, please visit TA Instruments.