The monitoring of contaminants in lubrication and hydraulic systems is evolving. Legacy methods for particle counting, such as Automated Particles Counters (light obscuration), have been the industry standard for decades. However, they are unable to distinguish between types of contamination or identify sources of contamination.
Image Credit: MR.Zanis/Shutterstock.com
On-site oil testing is the usual practice. Testing is performed to make quick decisions regarding machinery quality based on the particle count. As a result of this, Automated Particle counters have been a key method used for testing alongside more sophisticated measurement equipment back in testing labs, which provides more in-depth information on machinery health.
At-line testing followed by backup lab testing is the most common process for established quality processes to monitor machinery health. However, Automated Particle Counters are only capable of offering restricted information about the health of oil and machinery oil. This is performed using reporting cleanliness codes like the ISO 4406 and similar.
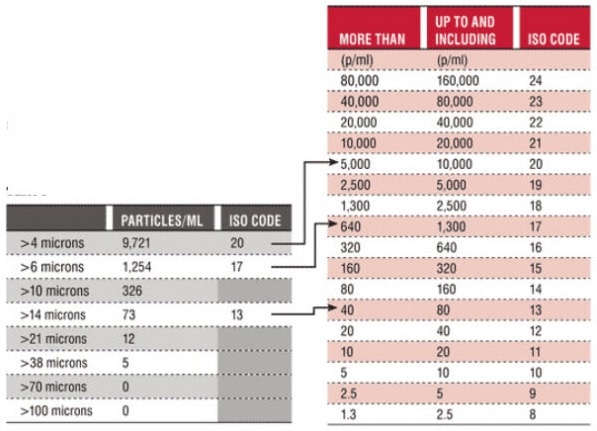
iso4406 reporting format. Image Credit: Vision Analytical Inc.
Using Automated Particle Counters to conduct at-line testing requires much expertise to prepare samples, run them, and analyze the results in a way that best tracks any changes in fluid health, helping the user understand the source of the change. For example, an increase in particle count could be the result of dangerous wear particles or water droplets. They both have different sources and different courses of action for the intervention and prevention of catastrophic failure.
This increase in particle count could simply be the result of the presence of air bubbles, which may not have any cause for concern. However, users cannot confidently determine this at the point of testing. Therefore, samples must be sent to a laboratory for further testing, which can take days or weeks. At this time, machinery may be sitting idle, or it may even be damaged further if used as further testing ensues. Both of these situations reduce profit.
Dynamic Image Analysis (DIA) has been developed because of such limitations in other technologies. DIA is an advanced technology that provides both qualitative and quantitative insights into contamination.
Following the introduction of the ISO 21018-1 standard, the industry now recognizes alternate methods for contamination monitoring, which has opened the door for Dynamic Imaging to become the new standard for assessing hydraulic fluid cleanliness at the source. As well as offering standardized reporting codes, Dynamic Imaging also provides thumbnail images of all of the measured particles that are greater than one micron, thus providing a source of objective evidence. This evidence allows operators to make accurate decisions quickly for corrective action.
Why Legacy Methods Fall Short
Light obscuration particle counting (calibrated to ISO 11171) has long been the default method for the monitoring of hydraulic oil contamination. However, this method has several limitations:
- Inability to Differentiate Between Contaminants: Light blockage methods count particles but cannot determine if they are gels, fibers, metal debris, water droplets, or gels.
- False Positives: Soft contaminants and air bubbles can interfere with light extinction measurements, causing inaccurate contamination levels.
- Limited Particle Size Range: Many of the traditional particle counters find it difficult to deal with very small (< 4 µm) and very large (> 100 µm) particles.
- Clogging: Traditional light-obscuration systems can easily become clogged by large particles. This requires them to have internal filters that prevent clogging but also prevent the detection of larger particles.
- Accuracy Concerns: Traditional particle counters will mathematically adjust the particle count by assuming coincidence. This is the assumption that, based on the size of the particles, there will statistically be some that are at the same place at the same time. Therefore, they may be counted as a single larger particle.
- Limited Versatility: Traditional particle counters are single-pass detection systems. Once the sample has been measured, it is dropped into waste, making it difficult to recover the sample for further analysis.
- No Visual Evidence: Maintenance teams have no direct evidence of the contamination source and type due to the lack of images.
The Dynamic Imaging Advantage
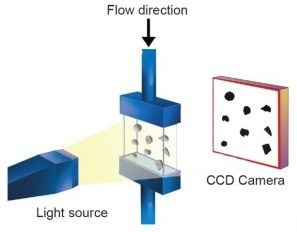
Figure showing the principle of operation behind dynamic image analysis. Image Credit: Vision Analytical Inc.
Dynamic Image Analysis (DIA) overcomes these limitations because it provides a clear and visual representation of fluid contamination. Instead of simply counting particles, DIA takes high-quality images of each individual particle, which allows for shape analysis and the identification of contamination sources.
Core Benefits of Dynamic Imaging for Contamination Monitoring:
At-Line and Real-Time Contamination Identification: DIA captures portable, high-resolution thumbnail images of contaminants, allowing users to differentiate between wear dirt, debris, water droplets, fibers, air bubbles, and gels, and take corrective action immediately based on the source of the contamination. No guessing is required, and no expert is needed.
Same Reporting Codes: Similarly to APCs, Dynamic Imaging offers all the reporting codes with a twist. The user can ‘see’ the particles in each class, which enables them to identify the contamination source.
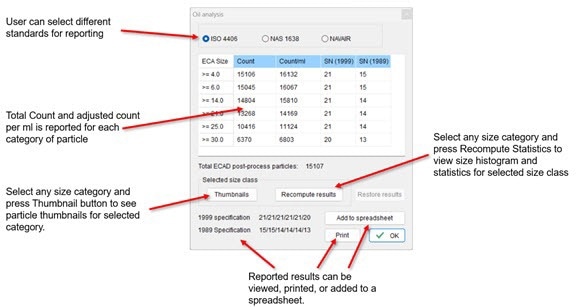
ISO 4406 reporting codes. Image Credit: Vision Analytical Inc.
Same Counting and Concentration: Like APCs, Dynamic Imaging is a number-based analysis system that can provide the total count as well as the concentration. However, its ability to differentiate particle types by shape and size means that Dynamic Imaging can also give count and concentration measurements for different classes of particles. Particle classes can be size classes (> 4 microns etc.) or shape classes (Cutting Wear etc.). This means users can obtain more detailed information on trends in particle counts by type, which APCs cannot.
Classify Particles: Al measured particles greater than one micron and smaller than 300 microns can be classified by the standard Noria Wear Atlas-based classifications.
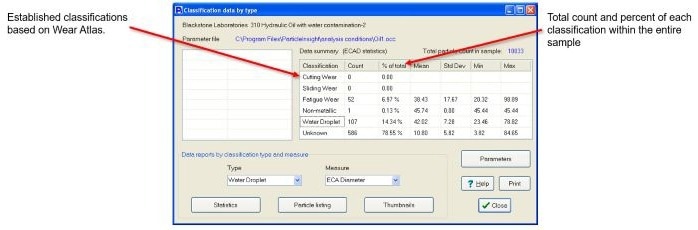
Particles can be classified by established wear classes or can be customized. Image Credit: Vision Analytical Inc.
The user can choose one particle class and see all of the particle thumbnails for the selected class. This objective evidence means that users can identify the contamination source and take immediate and accurate corrective action without guessing.
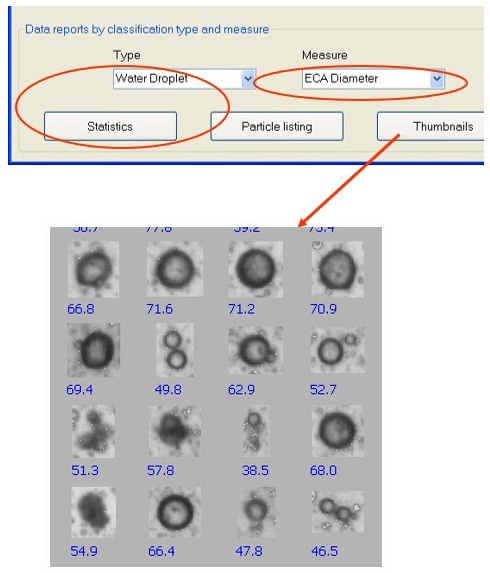
Particles can be classified by established wear classes or can be customized. Image Credit: Vision Analytical Inc.
Better Decision-Making for Maintenance: Maintenance teams can recognize and analyze the root cause of contamination rather than simply respond to trends in particle count.
Reduction in False Positive Results: By identifying and ignoring misclassified soft contaminants and bubbles, DIA improves contamination accuracy. Dynamic imaging does not require any coincidence correction. All particles between one and 300 microns are measured, and all images are saved.
Compliance with ISO 21018-1: DIA is recognized as a sound alternative method, meaning it is a contamination monitoring solution with strong potential for the future.
Easy Adaptability: DIA uses the same sample preparation methods as Automated Particle Counters.
Versatile Sampling: DIA can run in single-pass mode - similarly to APCs - but it can also be run in recirculating mode or with sterile syringes, which both help preserve your initial sample for future testing and reference.
Calibration Standards: Recognized calibration standards are available and similar to APC standards.
How Dynamic Imaging has Transformed Fluid Cleanliness Management
Source: Vision Analytical Inc.
| Feature |
Dynamic Imaging
(ISO 21018-1) |
Light Obscuration (ISO 11171) |
| Particle Identification |
Yes, with thumbnail images |
No, only counts |
| Shape Analysis |
Yes, to differentiate particles |
No |
Contaminant
Source ID |
Yes, with objective evidence images |
No |
False Positive
Reduction |
Yes, filters out air bubbles |
No, cannot differentiate |
Applicable to All
Fluids |
Yes, can operate with
limited opaque fluids. |
Limited to clear fluids |
|
|
ISO 21018-1 |
ISO 11171 |
The Market Shift: Why Industries are Adopting DIA
DIA’s ability to give deeper insights into contamination issues at the point of testing, providing an abundance of data, enables quick and accurate decision-making. As a result, industries that rely on hydraulic systems, fuel quality, and lubrication maintenance are moving toward this method. Some of the main sectors that are benefiting from DIA technology include:
Fuel and Lubrication Monitoring: Ensuring compliance with the same cleanliness standards that are used for APCs and detecting contamination sources in real-time reduces equipment downtime and damage that may be caused by waiting for slow lab results.
Manufacturing and Industrial Equipment: Precise contamination tracking reduces the occurrence of unexpected failures. DIA tracks classes of particles as well as particle count. An increase in particle count could be the result of something as insignificant as air bubbles being present because of poor sample prep, or something as urgent as an increase in fatigue wear or water droplets in oil.
Heavy Machinery and Hydraulic Systems: The identification of contaminants before they cause wear improves system efficiency.
Laboratory and R&D Applications: Detailed particle characterization, enhanced contamination studies.
The Future of Fluid Cleanliness: A New Industry Standard
With ISO 21018-1 validating innovative new monitoring technologies, Dynamic Imaging is set to become the new industry standard. By providing deeper insights into contamination, real-time imaging, and better accuracy, DIA is revolutionizing the manner in which industries monitor and manage fluid cleanliness.

This information has been sourced, reviewed and adapted from materials provided by Vision Analytical Inc.
For more information on this source, please visit Vision Analytical Inc.