Particle measurements in ultra-pure water (UPW) systems can take a long time to return to a stable baseline after an incident that disrupts regular operation (such as a maintenance shutdown).
A characterization study was conducted to determine the contribution of key elements to the stabilization time of measurements in UPW for particles 20 nm and larger. It was discovered that invasive actions, such as inserting new sample tubing and components, had the greatest effect on stabilization time.
Contrastingly, non-invasive operations, such as PTFE and PFA valve actuation and the particle counter's standard warm-up period, had a far less significant effect. It was also demonstrated that specific steps, such as thorough flushing of new tubing and components and reducing sample tubing lengths, can significantly reduce particle clean-up time.
Introduction
Modern ultra-pure water (UPW) systems must be cleaned to meet the increasingly stringent requirements of high-end manufacturing processes. High-end UPW systems often have particle concentrations in the single-digit particles/mL range or below for particles larger than 20 nm.
Monitoring particles in a UPW system is critical to ensuring the particle level remains within acceptable control limits and does not jeopardize production.
When the steady-state ‘baseline’ particle level is low, it can take a long time for particle counts to return to the baseline level. This can be caused by major interruptions to the system's regular operation, such as shutdowns to perform maintenance and install new components or sample lines.
Depending on the system’s size and complexity, the stabilization period may be several weeks or even months. Furthermore, the high-sensitivity particle counters used to monitor particle levels in UPW systems take time to establish a stable operating temperature after powering on.
During the first warm-up phase, the particle counter’s reported counts may temporarily increase before returning to normal as the instrument reaches thermal stability.
This article describes the results of an evaluation conducted with an Ultra DI® 20 (UDI-20) Liquid Particle Counter to evaluate various aspects influencing particle measurement stabilization time in a UPW system.
The examined factors include the warm-up period after turning on the power, the effect of detaching and reconnecting sample tubes and replacing the flared connection, the clean-up time after installing new sample tubes of different lengths, and the clean-up time after installing a new PFA diaphragm valve.
These findings should help the reader understand why UPW systems can take a long time to clean up after an interruption and which factors are likely to have the greatest impact.
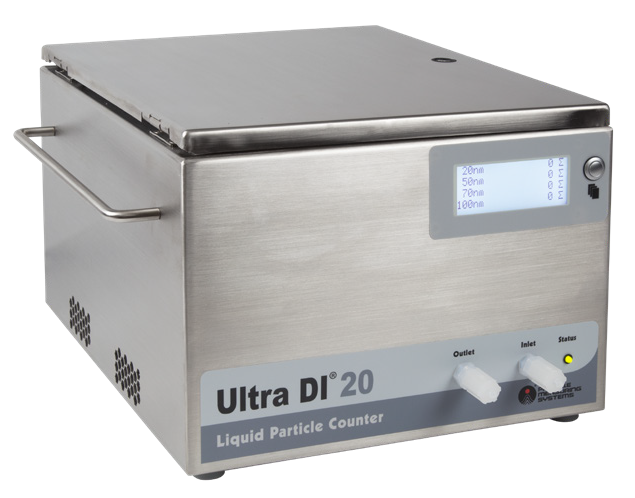
Figure 1. Ultra DI® 20 (UDI 20) Liquid Particle Counter. Image Credit: Particle Measuring Systems
Test Schematic and Description
Figure 2 shows a schematic of the test setup. The UDI-20 particle counter was connected to the UPW supply using ¼-inch OD PFA sample tubing, with a bubble separator installed upstream of the UDI-20. This is a precautionary measure to protect the particle counter from large air bubbles that may be introduced into the system.
A bypass flow controller was installed upstream from the bubble separator to facilitate flushing the sample line. A manually activated PTFE diaphragm valve was placed at the UPW source to stop and start the flow.
The average baseline particle count for particles 20 nm and larger was measured to be below 3 particles/mL before the evaluation began.
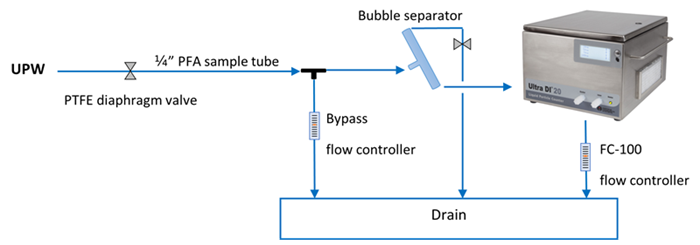
Figure 2. Test Schematic. Image Credit: Particle Measuring Systems
Non-Invasive and Invasive Factors
The term ‘non-invasive factors’ refers to the adjustments or actions made to an existing UPW system that do not entail replacing old parts or installing new components. Non-invasive factors include power cycling the particle counter, closing and opening valves, disconnecting and reconnecting sample tubing, and re-flaring previously used sample tubing.
The term ‘invasive factors’ refers to system changes that require the replacement or installation of new parts, such as inserting new sample tubing and/ or valves upstream from the particle counter.
Evaluation of Non-Invasive Factors
Instrument Warm-Up After Powering On
High-sensitivity liquid particle counters, such as the UDI-20, take time to establish a steady-state operating temperature after powering on. During this initial warm-up stage, the particle counter is likely to temporarily display higher particle counts due to the rapid increase in internal temperature.
When the device has warmed up sufficiently, the particle counts restore to their baseline level. After turning on the UDI-20, the time it took for the particle count to restore to the baseline level (the ‘stabilization time’) was calculated. The test was conducted three times, and the results are given in Figure 3.
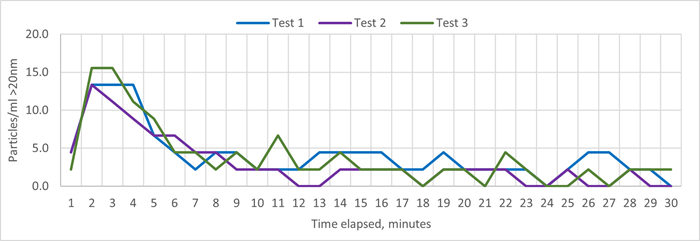
Figure 3. Instrument Stabilization Test Results. Image Credit: Particle Measuring Systems
In each of the three cases, turning on the particle counter resulted in a similar increase in particle counts in the 20-nm channel. However, after about 10 minutes, all particle counts reverted to their baseline levels.
The actual steady-state working temperature varies from instrument to instrument, as does the minimum stabilization time, but this example should represent the average warm-up behavior of a UDI-20 particle counter.
Actuating the Diaphragm Valve
Closing and opening valves in UPW systems can cause particle release due to component movement and frictional forces. The increased flow once a valve is opened can cause particles to detach from tube walls, fittings, filters, and other components, temporarily increasing particle counts.
After activating the PTFE diaphragm valve, the time it took for particle counts to return to their baseline level (the ‘clean-up time’) was calculated. As before, the test was repeated three times, and Figure 4 shows the results.
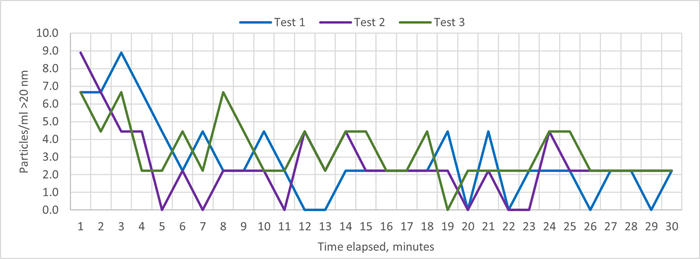
Figure 4. Valve Actuation Test Results. Image Credit: Particle Measuring Systems
Immediately after opening the valve, all three tests show a minor rise in particle count. However, after around five minutes, the particle counts had all reverted to their baseline levels.
It should be mentioned that the particle cleanliness of different valves varies significantly depending on their kind and condition. Particle Measuring Systems’ expertise has shown that high-quality PTFE and PFA diaphragm valves can operate relatively cleanly.1
Other valve types and low-quality valves may produce far more particle contamination than the PTFE diaphragm valve employed in this study. Larger, more sophisticated UPW systems would also have more tubing and components that could shed particles due to the flow change caused by valve actuation, resulting in longer clean-up periods.
Disconnecting and Reconnecting Sample Tubing
Connecting and disconnecting sample tubing can introduce particles into the system due to frictional forces between surfaces, and particles can also become separated from interior surfaces as the sample tubing and fittings are moved. The clean-up time after detaching and reconnecting the sample tube at the UDI-20 input was measured three times, and the results are presented in Figure 5.
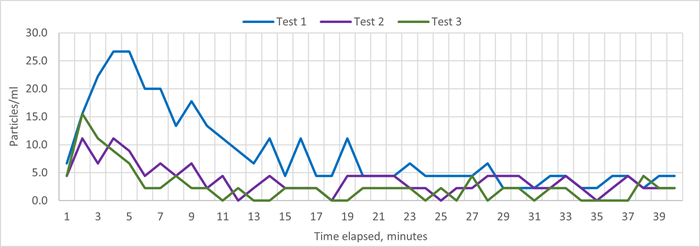
Figure 5. Disconnecting/Reconnecting Tubing Test Results. Image Credit: Particle Measuring Systems
All three cases show an apparent rise in particle counts, with the highest increase occurring after the sample tubing was detached and rejoined for the first time.
The findings indicate that the rise in particle counts is primarily due to particles already present in the system becoming dislodged from interior surfaces when the sample tubing and fittings were disrupted. The contribution of freshly introduced particles into the system in test 1 is greater than in tests 2 and 3.
It took around 20 minutes for the system to restore to the baseline level after the first test, but just 10 and six minutes following tests 2 and 3, respectively. It should be noted that this test also involved closing and reopening the diaphragm valve, so some of the particles discovered may have originated from the valve, as demonstrated in the prior test.
Flaring the Sample Tube
‘Flaring’ a sample tube involves expanding the end of the tube such that it fits over a flare-shaped fitting that is larger in diameter than the tubing. Such flared connections are widely employed throughout the electronics industry. This stretching can generate surface tension and particle separation.
For this test, the existing flare on the sample tube connected to the UDI-20 intake was removed, and a new flare was installed with a handheld flaring tool. The clean-up time after renewing the flare on the sample tube was evaluated three times, and the results are shown in Figure 7.
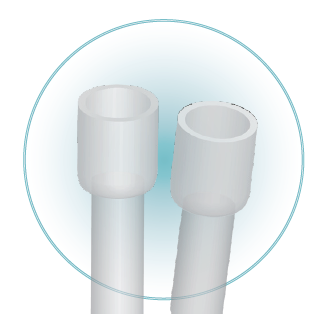
Figure 6. Flared Tubing. Image Credit: Particle Measuring Systems
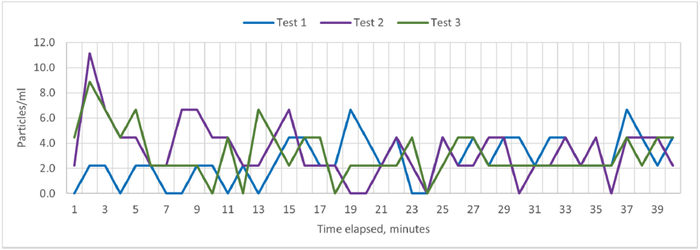
Figure 7. Flaring the Sample Tube Test Results. Image Credit: Particle Measuring Systems
The results of experiments 2 and 3, presented in Figure 7, reveal that flaring the sample tube did not significantly increase particle contamination in the system as compared to merely detaching and reconnecting the sample tubing (as shown in Figure 5).
In all situations, the system needed around 15–16 minutes to restore its baseline level. However, particle counts for test 1 increased over time and remained consistently higher than the baseline, indicating a small leak in the new connection.
Particle Measuring Systems has discovered that such leaks can induce high particle counts with no obvious signs of leakage. This finding underscores the need to ensure that all connections are properly prepared and airtight when working on UPW systems.
The flaring procedure used in this research did not require heating the tube to soften the material. The results may alter if the tube is flared differently, for as by stretching it over a mandrel after heating.
Evaluation Results: Invasive Factors
Installing a New Sample Tube
Installing new components in a UPW system may introduce particle contamination that can take some time to remove. New components, such as sample tubes and valves, may have considerable particle contamination from the manufacturing, shipping, and installation procedures.
Figure 8 shows the results when the existing 80 cm sample tube was replaced with an identical, freshly manufactured sample tube. The test was conducted three times using three identical sample tubes.
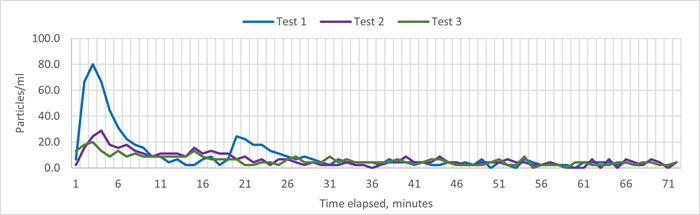
Figure 8. Installing a New Sample Tube: Test Results. Image Credit: Particle Measuring Systems
Each of the three experiments resulted in a large rise in particle counts, which took a relatively long time to clean up. In fact, the system never fully recovered to its baseline level throughout the time allowed for the examination. As a result, the 95% clean-up time was chosen as an alternative statistic.
The 95 % clean-up times for all three experiments are similar, ranging from 65 to 72 minutes. These findings illustrate that even a short length of fresh sample tubing installed in a UPW system can introduce significant particle contamination, which may take a long time to clean out completely.
Installing a New Sample Tube After Flushing
A viable technique for reducing the stabilization period of particle measurements in UPW systems is to flush the freshly installed components and sample lines at a high flow rate.
For this test, the small sample tube between the bubble separator and the UDI-20 was replaced with a new one-meter-long sample tube, and the 95 % clean-up time was measured initially without flushing the tube.
The tube was then changed to another identical sample tube, and the 95 % clean-up time was calculated again after flushing for 15 seconds. The flushing was performed by fully opening the bypass flow controller, which allowed a maximum flow rate of approximately 500 mL/min. The results of these experiments are given in Figures 9 and 10.
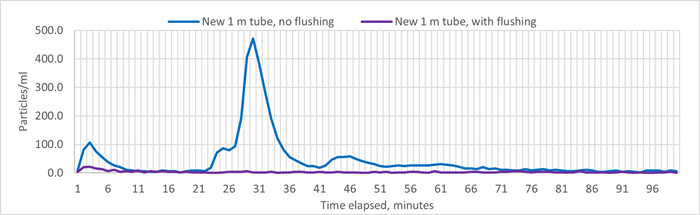
Figure 9. Effect of Flushing After Installing a New Sample Tube (Full Graph). Image Credit: Particle Measuring Systems
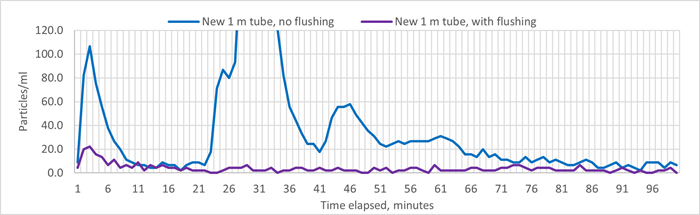
Figure 10. Effect of Flushing After Installing a New Sample Tube (Zoomed In). Image Credit: Particle Measuring Systems
The contrast between these figures shows that flushing the sample tube after installation greatly reduced clean-up time. Without flushing, particle counts were elevated and unstable, and it took about 90 minutes to restore to a 95 % clean-up rate.
With flushing, particle counts remained elevated but were substantially lower and steadier, returning to 95 % clean-up after about 25 minutes. After approximately 100 minutes of flushing, particle counts reverted to their baseline levels. The test never returned to baseline levels without flushing, even after 24 hours of sampling.
Effect of Sample Tubing Length
The internal surface area of a sample tube increases with its length, meaning there is more room for contamination to enter, and particles must travel a longer distance before they can exit.
It is projected that longer sample tubes will introduce more pollution into the system and necessitate a longer cleanup time. For this test, the short sample tube connecting the bubble separator to the UDI-20 input was replaced with longer sample tubes measuring 3 m, 7 m, and 10 m.
Before beginning the measurement, the new sample tubes were flushed for 15 seconds at approximately 500 mL/min. Figure 11 shows a plot of the observed 95 % clean-up time versus sample tube length.
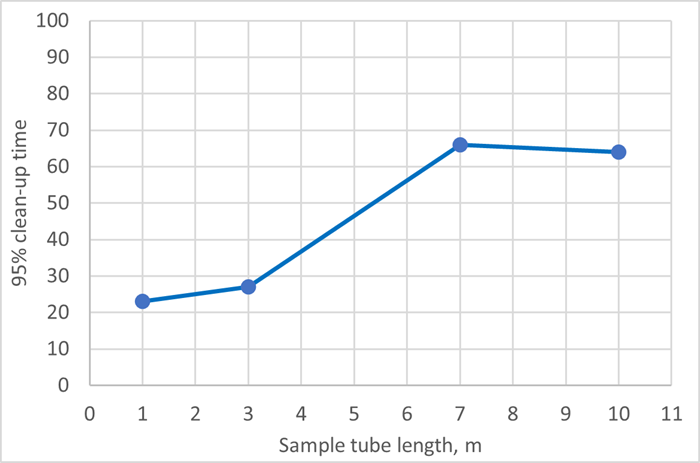
Figure 11. Clean-up Time vs. Sample Tubing Length. Image Credit: Particle Measuring Systems
As expected, the results demonstrate that clean-up time increases with sample tube length. The one- and three-meter sample tubes were cleaned in 20–30 minutes, while the seven- and 10-meter sample tubes took 60–70 minutes.
The fact that the seven-meter sample tube took somewhat longer to clean up than the 10-meter tube was an unexpected result, but this is likely due to the difficulty of ensuring that all sample tubes are in the same condition at the start of the test. Despite this outlier, it is clear that sample tubing length has a significant impact on clean-up time.
Installing a New Valve
Installing valves and other active components can lead to significant particle contamination in UPW systems. Even if components are crafted to remain as clean as possible during use, they may still retain substantial residual particle pollution from manufacturing and packaging processes. The installation may also bring particle contamination into the system, causing particles to separate from interior surfaces.
For this test, an extra PFA diaphragm valve was added just upstream of the bubble separator, and the clean-up time was evaluated after 15 seconds of flushing at 500 ml/min. The sample tube’s length from the bubble separator to the UDI-20 input was 80 cm.
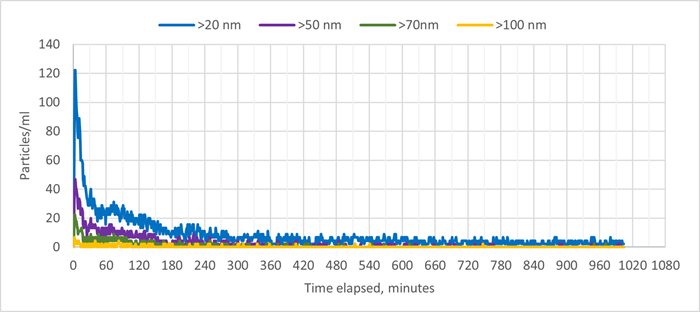
Figure 12. Installing a New PFA Valve. Image Credit: Particle Measuring Systems
Figure 10 shows the particle counts in the UPW system after the additional valve was installed and opened, following a 15-second flush. Installing the valve caused significant particle pollution in the system, which needed many hours to clean up.
The 95% clean-up time was estimated at 270 minutes, and it took about 790 minutes for particle counts to return to baseline levels.
The time required to clean up after installing a new valve will vary greatly depending on the type of valve, the size and complexity of the UPW system. This result depicts how the introduction of additional components can affect the cleanliness of a UPW system over time.
Data Summary
The results of the characterization are summarized in Tables 1 and 2.
Table 1. Summary of Non-Invasive Test Results. Source: Particle Measuring Systems
| |
Stabilization Time (minutes) |
| Test Description |
Stabilization Criteria |
Test 1 |
Test 2 |
Test 3 |
| Laser warm-up after powering on the UDI-20 |
Return to baseline |
7 |
10 |
9 |
| Clean-up after valve actuation |
Return to baseline |
5 |
4 |
7 |
Clean up after disconnecting and
reconnecting the sample tube |
Return to baseline |
20 |
10 |
6 |
| Clean-up after renewing flare |
Return to baseline |
> 60 (leak) |
16 |
15 |
Table 2. Summary of Invasive Test Results, Installation of New Tube and Valve. Source: Particle Measuring Systems
| |
Stabilization Time (minutes) |
| Test Description |
Stabilization Criteria |
Test 1 |
Test 2 |
Test 3 |
Installation of a new 80 cm sample
tube (without flushing) |
95 % clean-up |
66 |
72 |
65 |
Installation of a new
valve (flushed for 15 seconds) |
95 % clean-up |
271 |
- |
- |
| Return to baseline |
792 |
- |
- |
Table 3. Summary of Invasive Test Results, Different Sample Tubing Lengths. Source: Particle Measuring Systems
| Test Description |
Stabilization Criteria |
Tubing length, m |
Flushed for
15 seconds |
Stabilization
time (minutes) |
Clean-up after installation of different
sample tube lengths |
Return to baseline |
1 |
No |
Not achieved |
| Yes |
100 |
| 3 |
Yes |
927 |
| 7 |
Yes |
Not achieved |
| 10 |
Yes |
Not achieved |
| 95 % clean-up |
1 |
No |
87 |
| Yes |
23 |
| 3 |
Yes |
27 |
| 7 |
Yes |
66 |
| 10 |
Yes |
64 |
Particle Count Stabilization in Real-World UPW Systems
Real-world, high-end UPW systems are much larger and more sophisticated than the modest, simple setup used in this evaluation. Due to more invasive variables, such systems can take several months to fully stabilize particle counts above 20 nm.2
Figure 13 shows particle counts obtained over a one-month period using a UDI-20 deployed on a UPW system at a semiconductor company. In this example, the UPW system had already been operational for several months before data gathering began.
At the beginning of the month, the particle count greater than 20 nm was 2-2.5 particles/ml. By the end of the month, this value had dropped by more than 50 % and was still declining.
Conversely, if only particles larger than 50 nm had been tracked, the system would have appeared completely stable at the start of the data-collection period. The findings highlight the need for a high-sensitivity particle counter to assess the quality of UPW systems.
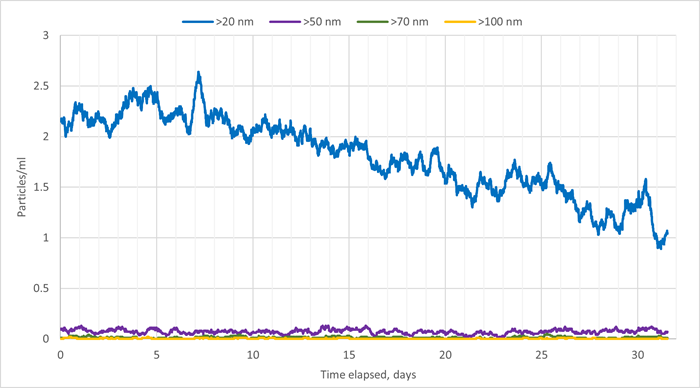
Figure 13. Particle Count Declining in UPW at a Semiconductor Manufacturer During Stabilization. Image Credit: Particle Measuring Systems
Conclusion
The ultra-low particle concentrations in high-end UPW systems can cause particle readings to take a long time to stabilize after an interruption in the system’s normal operation.
This characterization study demonstrates how invasive elements, such as installing new fluid handling components and sample tubing, can drastically affect stabilization time.
Non-invasive elements, such as the operation of clean PFA or PTFE valves and the warm-up period of the particle counting, are likely to be far less important. Furthermore, it was demonstrated that the particle stabilization period rises with sample tube length.
While there is no way to completely eliminate this stabilization phase, steps can be taken to make it as brief as feasible. Ensuring that sample lines are as short as possible, using only clean-operating valves and other components, and thoroughly flushing sample lines are all efficient ways to achieve stable particle measurements in the least time.
References
- Particle Measuring Systems. (2018). Component Cleanliness Testing for Liquid Systems. (online) Available at: https://www.pmeasuring.com/application_note/component-cleanliness-testing-for-liquid-systems/.
- Particle Measuring Systems. (2022). Understanding Nanoparticle Contamination in Ultrapure Water (UPW) Systems. (online) Available at: https://www.pmeasuring.com/application_note/understanding-nanoparticle-contamination-in-ultrapure-water-upw-systems/.
Acknowledgments
Produced using materials originally authored by David Green and Peter Sun, Applications Engineer and Application Manager at Particle Measuring Systems.

This information has been sourced, reviewed, and adapted from materials provided by Particle Measuring Systems.
For more information on this source, please visit Particle Measuring Systems.