The cement’s particle size distribution directly impacts the final set concrete’s strength, hardening rate, and fluidity. Thus, accurate and repeatable measurement of cement particle size is key to ensuring product quality and reducing the high costs typically associated with cement production.
A range of historical techniques has been employed in the measurement of cement’s particle size and fineness. For example, 45-micron sieves provide the second largest dimension, Blaine air permeability predicts compressive strength by a single number, and the Wagner turbidimeter does too.
These techniques required a minimum measurement time of 5 minutes and were limited to only providing a single number.
The 1990s saw laser diffraction become the instrument of choice, however. This technique is simple, straightforward, and reproducible, as well as being much faster than older methods. This method also calculates many more relevant parameters, enabling increased optimization of cement’s particle size distribution.
Applying the laser diffraction technology, the Bettersizer 2600 Plus laser diffraction analyzer is highly suited to use in the cement sector, offering QC and laboratory managers the information required to optimize production efficiency while maintaining specifications.
Besides, the Bettersizer 2600 Plus can also measure both the size and shape of cement particles (Figure 1), opening up new research areas in terms of optimal particle size and particle shape.
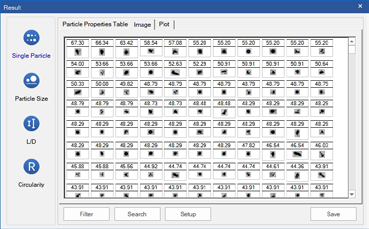
Figure 1. Dynamic image analysis of the cement. Image Credit: Bettersize Instruments
Understanding Cement Production
Ordinary Portland Cement (OPC) is the most common cement. This type of cement is a gray powder. Other types of cement are produced for different applications, however. Cement is generally produced through a three-stage process.
The first stage of cement production involves the raw milling of limestone using a primary crusher. Here, the rocks are reduced to approximately the size of baseballs.
A secondary crushing stage is then performed, further reducing the particle size to around 2 cm.
The second clinkering stage involves the mixing and treating of this ground material, silica, fly ash, iron ore, and occasionally alumina shale in a preheater where the temperature increases from 80 °C to 800 °C. The mix is calcined at this temperature, removing the CO2.
The feed is then sent to a roller mill where the dry raw meal is created before being transported to the rotary kiln. Ingredients are then heated up to 1450-1550 °C, triggering a chemical reaction which removes a range of elements in gaseous form.
The remaining elements form a gray material referred to as the clinker. It is important to maintain a balance here, avoiding both insufficient heat, which results in under-burnt clinker containing unconverted lime, and excessive heat, which reduces the lifetime of the kiln’s refractory bricks.
After cooling, the clinker is ground to ensure a cement fineness under 45 microns. Gypsum is blended with the ground clinker to control the cement hydration rate, ensuring its setting time is appropriate for the specific application.
Milling requires significant amounts of electrical energy, with total power demand depending on the distribution of particle size, the fineness of the grind, and the efficiency of separation of the finely ground particles.
A finer grind results in more reactive finished cement and, therefore, a more rapid setting time.
Reducing the particle size generally increases the rate of hydration and strength. For example, rapid-setting cements feature a smaller particle size than the less reactive, low heat of hydration cements.
Experimental
The study presented here focuses on cement grades 32.5, 42.5, and 52.5, named after the expected strength derived from their respective optimized particle size distributions or fineness.
The Bettersizer 2600 Plus can measure cement fineness in its natural dry state or as a wet dispersion, utilizing an industrial alcohol such as ethanol or propanol.
Both wet and dry dispersion methods yield the same result (Figure 2), but the dry method is preferred due to its reduced running costs, improved statistical representation, and more straightforward usage.
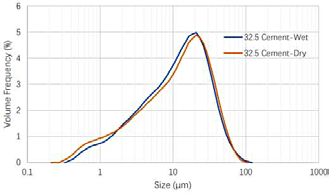
Figure 2. Particle size results of 32.5 cement by wet and dry dispersion. Image Credit: Bettersize Instruments
Table 1. Typical values of 32.5 cement by wet and dry dispersion. Source: Bettersize Instruments
| Sample Name |
D10 (μm) |
D50 (μm) |
D90 (μm) |
| 32.5 Cement - Wet |
1.912 |
11.41 |
32.56 |
| 32.5 Cement - Dry |
1.525 |
11.57 |
33.85 |
Up to five different parameters must be taken into account when performing a wet analysis of cement, including the pump speed, solvent used, the need for ultrasound, ultrasonic dispersion time, and the strength of the ultrasound.
There is only one requirement when using the dry analysis method: the need to generate a pressure titration curve by measuring the cement at four different pressures, generally from 1-4 bar.
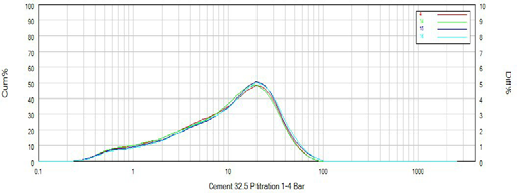
Figure 3. Particle size results of 32.5 cement at 4 different pressures from 1-4 bar. Image Credit: Bettersize Instruments
Table 2. Typical values of 32.5 cement at 4 different pressures from 1-4 bar. Source: Bettersize Instruments
| Sample Name |
D06 (μm) |
D10 (μm) |
D16 (μm) |
D25 (μm) |
D50 (μm) |
D75 (μm) |
D84 (μm) |
D90 (μm) |
D97 (μm) |
| 32.5 Cement – 1 bar |
1.065 |
1.692 |
2.803 |
4.706 |
12.47 |
23.45 |
29.60 |
35.78 |
51.63 |
| 32.5 Cement – 2 bar |
1.002 |
1.579 |
2.624 |
4.509 |
12.18 |
22.78 |
28.58 |
34.54 |
50.06 |
| 32.5 Cement – 3 bar |
0.950 |
1.465 |
2.410 |
4.107 |
11.17 |
21.80 |
27.51 |
33.25 |
46.92 |
| 32.5 Cement – 4 bar |
0.935 |
1.438 |
2.368 |
4.089 |
11.13 |
21.24 |
26.88 |
32.50 |
46.00 |
Results can change at different pressures in the case of many applications in other industries, but the variation between results at four different pressures is minimal in this instance (Figure 3).
A pressure of 3 bar is generally recommended for dispersion, with a vacuum utilized to suck away the dispersed particles once they have exited the measuring area.
A measurement is performed by placing a sample of cement on the dry sample feeder (Figure 4). The user then clicks an icon on the computer screen to perform a fully automated measurement and analysis of any number of repeat results.
A total of five repeat analyzes were attained in less than 90 seconds in this case (Figure 5). As well as measuring the cement itself, it is also possible to measure additives such as fly ash (Figure 6).
In the example presented here, comparison graphs of measurements were created for grades of cement (32.5, 42.5, and 52.5) and the fly ash (Figure 7).
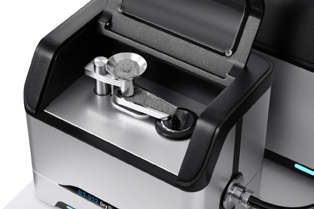
Figure 4. Cement is added to the sample tray of the dry sample feeder. Image Credit: Bettersize Instruments
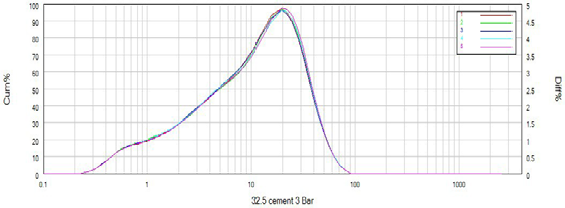
Figure 5. Particle size distribution and repeatability of 32.5 cement. Image Credit: Bettersize Instruments
Table 3. Typical values of 32.5 cement. Source: Bettersize Instruments
| Sample Name |
D06 (μm) |
D10 (μm) |
D16 (μm) |
D25 (μm) |
D50 (μm) |
D75 (μm) |
D84 (μm) |
D90 (μm) |
D97 (μm) |
| 32.5 Cement – 3 bar - 1 |
0.958 |
1.488 |
2.450 |
4.180 |
11.29 |
21.60 |
27.33 |
33.13 |
46.91 |
| 32.5 Cement – 3 bar - 2 |
0.942 |
1.450 |
2.402 |
4.123 |
11.34 |
21.80 |
27.55 |
33.32 |
46.82 |
| 32.5 Cement – 3 bar - 3 |
0.946 |
1.461 |
2.400 |
4.090 |
11.05 |
21.40 |
27.08 |
32.76 |
46.42 |
| 32.5 Cement – 3 bar - 4 |
0.950 |
1.465 |
2.410 |
4.107 |
11.17 |
21.80 |
27.51 |
33.25 |
46.92 |
| 32.5 Cement – 3 bar - 5 |
0.955 |
1.482 |
2.451 |
4.179 |
11.44 |
22.11 |
27.74 |
33.42 |
46.65 |
| Repeatability |
0.68 % |
1.06 % |
1.06 % |
1.01 % |
1.35 % |
1.22 % |
0.91 % |
0.77 % |
0.45 % |
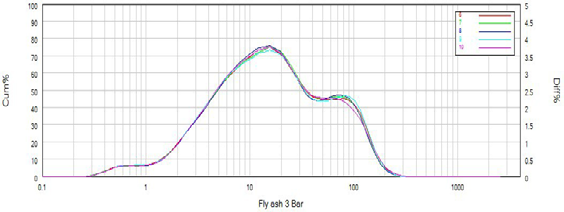
Figure 6. Particle size distribution and repeatability of fly ash. Image Credit: Bettersize Instruments
Table 4. Typical values of fly ash. Source: Bettersize Instruments
| Sample Name |
D06 (μm) |
D10 (μm) |
D16 (μm) |
D25 (μm) |
D50 (μm) |
D75 (μm) |
D84 (μm) |
D90 (μm) |
D97 (μm) |
Fly Ash –
3 bar - 6 |
2.077 |
2.976 |
4.293 |
6.439 |
15.18 |
39.24 |
62.89 |
86.20 |
132.0 |
Fly Ash –
3 bar - 7 |
2.132 |
3.026 |
4.340 |
6.480 |
15.33 |
38.82 |
61.78 |
83.78 |
128.3 |
Fly Ash –
3 bar - 8 |
2.135 |
3.041 |
4.371 |
6.510 |
15.06 |
38.57 |
62.05 |
82.63 |
127.6 |
Fly Ash –
3 bar - 9 |
2.098 |
2.992 |
4.285 |
6.385 |
15.29 |
39.95 |
64.77 |
87.97 |
132.3 |
Fly Ash –
3 bar - 10 |
2.123 |
3.017 |
4.317 |
6.414 |
15.04 |
38.17 |
60.57 |
83.10 |
132.0 |
| Repeatability |
1.18 % |
0.87 % |
0.81 % |
0.78 % |
0.86 % |
1.75 % |
2.50 % |
2.44 % |
1.76 % |
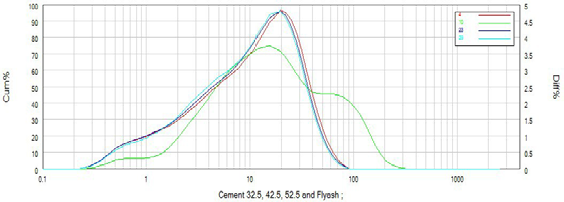
Figure 7. Comparison measurements from 3 grades of cement (32.5, 42.5 and 52.5) and the fly ash. Image Credit: Bettersize Instruments
Table 5. Typical values of cement (32.5, 42.5 and 52.5) and the fly ash. Source: Bettersize Instruments
| Sample Name |
D06 (μm) |
D10 (μm) |
D16 (μm) |
D25 (μm) |
D50 (μm) |
D75 (μm) |
D84 (μm) |
D90 (μm) |
D97 (μm) |
| 32.5 Cement – 3 bar - 4 |
0.950 |
1.465 |
2.410 |
4.107 |
11.17 |
21.80 |
27.51 |
33.25 |
46.92 |
| 42.5 Cement – 3 bar - 23 |
0.948 |
1.454 |
2.356 |
3.955 |
10.57 |
20.60 |
26.03 |
31.28 |
44.44 |
| 52.5 Cement – 3 bar - 29 |
1.006 |
1.543 |
2.429 |
3.941 |
10.29 |
19.98 |
25.23 |
30.45 |
43.14 |
| Fly Ash – 3 bar - 10 |
2.123 |
3.017 |
4.317 |
6.414 |
15.04 |
38.17 |
60.57 |
83.10 |
132.0 |
Results and Discussion
It is possible to display the results from all these experiments in graphical, tabular, percentage, or Tromp (efficiency of separation) curve forms.
Among curves, data, and graphs, the percentage of ground cement between 3 and 32 microns is most widely valued within the cement industry. This percentage should theoretically approach 70 % to exhibit optimal strength properties. This is because particles larger than 45 microns are not fully hydrated, while an excess of particles smaller than 3 microns results in faster exothermal setting in the final product due to the increased heat of hydration.
It is also possible to add increased amounts of gypsum to inhibit the increased heat of hydration, allowing the setting time to be controlled as water is added to the cement. The addition of gypsum can be an unnecessary cost, however, particularly in cases where the grinding process has been optimized.
Based on test results, the cement samples will have 70 % of their particles by volume between 3 and 32 microns. Alternative additives, like fly ash or gypsums, can also be measured to investigate their effect on overall size distribution, better determining how much to add to reach optimal strength.
The Bettersizer 2600 Plus is a rapid and straightforward particle size analyzer designed for use in quality control and research settings.
Its ability to measure both particle size and shape in a single analysis offers considerable benefits when working with new raw materials or additives, offering more in-depth insight into material properties and supporting better-informed decision-making in production and laboratory settings.
Cement particle size is now regarded as critical in the determination of cement quality. Finer particle sizes have a greater surface area, impacting the cement’s setting rate and compressive strength.
The cement particle’s shape also has an effect, however, as spherical particles will exhibit a lower surface area than cement that is irregular in shape, even if both populations are nominally the same size.
Spherically shaped cement requires less water in a cement mix, with water requirements increasing as the particles become more irregular in shape.
Conclusion
The significant power demands of finish milling mean that optimization of the classifier speed and enhanced monitoring of the grinding efficiency have the potential to yield an in-specification product with considerable energy efficiency improvements and resulting cost savings.
Laser diffraction represents the best means of achieving these goals. This quick, easy-to-use method offers consistent, repeatable results, irrespective of which operator is utilizing the system.
Control standard results for each cement grade are stored within a database, allowing all newly produced cement grades to be compared to the ideal product's fineness parameters in a matter of seconds.
Operators can set upper and lower set point limits on each key parameter, alerting them when the latest grind meets the specifications for that grade of cement.
The Bettersizer 2600 Plus combines rapid laboratory fineness analysis with comprehensive software functionality, ensuring that cement meets specifications and is consistently fit for purpose.
New feed materials and additives continue to be introduced, with various morphologies and sources. Because the Bettersizer 2600 Plus integrated laser diffraction and dynamic image analysis system measures both particle size and shape, it is ideally placed to meet these challenges thanks to its versatility and adaptability.
The Bettersizer 2600 Plus meets the industry’s growing demand for control over both particle shape and size, helping to improve product performance and economics.
Acknowledgments
Produced from materials originally authored by Zhibin Guo from Bettersize Technologies.

This information has been sourced, reviewed and adapted from materials provided by Bettersize Instruments.
For more information on this source, please visit Bettersize Instruments.