The transition from liquid or gel electrolytes to solid-state electrolytes (SSEs) in All-Solid-State Batteries (ASSBs) represents a pivotal evolution in lithium-ion technology. Using a solid instead of a liquid electrolyte has the potential to offer improved energy density, safety, and longevity.
An ASSB’s performance, however, is intrinsically linked to the solid-state electrolyte’s (SSE) physical properties. In particular, the Particle Size Distribution (PSD) underpins a range of key critical quality attributes (CQAs), including:
- Sintering behavior: Optimized particle sizes help reduce residual porosity and enable dense microstructures.
- Ionic conductivity: Well-packed particles are key to minimizing tortuous pathways for ion transport.
- Interfacial contact: A balanced distribution supports a reduction in interfacial impedance between the electrolyte layers and the electrode.
Despite its criticality, the accurate characterization of high-performance sulfide and halide electrolytes presents a significant analytical challenge.
These materials exhibit extreme hygroscopicity, meaning that even brief exposure to ambient moisture can trigger rapid hydrolysis, causing artificial agglomeration that distorts particle size results and generating hazardous gases such as H2S.
This article outlines the use of a specialized measurement approach designed to ensure the safe, accurate, and reproducible PSD characterization of the highly reactive solid electrolyte battery materials employed in next-generation ASSB development. The approach leverages the Bettersizer 2600 Plus particle size analyzer integrated directly into an inert-atmosphere glovebox.
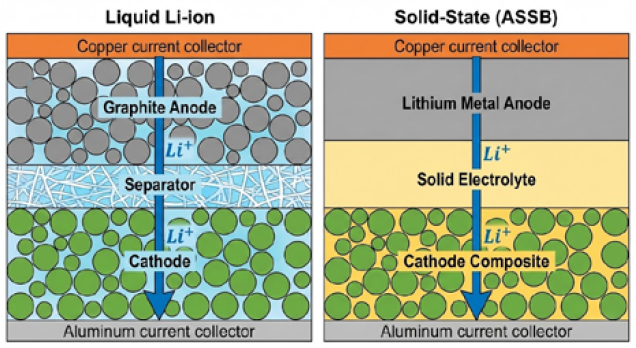
Figure 1. Conventional lithium-ion battery versus ASSB structure. Image Credit: Bettersize Instruments
Experimental Setup: The Inert Environment Solution
A Bettersizer 2600 Plus Laser Diffraction Analyzer was installed inside a custom-engineered inert-atmosphere glovebox to ensure the accurate measurement of moisture-sensitive electrolytes while preventing environmental contamination (Figure 2).
This integrated system ensures complete isolation from ambient air, enabling safe and reproducible PSD analysis under tightly controlled conditions.
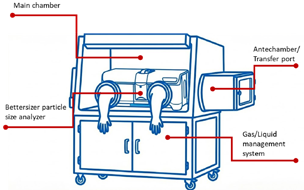
Figure 2. Diagram of the inert-atmosphere glovebox system with the Bettersize instrument. Image Credit: Bettersize Instruments
General System Features
The instrument installation and glovebox incorporate a range of useful capabilities, including:
- A fully inert gas atmosphere (He, N2, Ar), with H2O and O2 levels maintained below 1 ppm
- Active pressure management designed to maintain consistently stable internal operating conditions
- Airtight feedthrough ports for control cables, electrical connections, and gas and liquid lines
- Corrosion-resistant internal surfaces designed to ensure long-term compatibility with reactive materials
Dry Dispersion System Features
The system includes a range of features for dry-powder characterization, including:
- A compressed inert gas dispersion source designed to prevent moisture exposure during dry powder dispersion
- Two integrated dust collection systems, one for collecting residual sample material after testing and one dedicated to capturing airborne particulates within the glovebox
- Real-time visual monitoring via a viewing window integrated into the dust-collection tank
Wet Dispersion System Features
The system also includes a range of features suitable for wet-dispersion analysis, including:
- A built-in liquid waste collection and recovery system designed to support the safe handling of test media
- A low-moisture liquid medium (< 1 % water content) that helps to prevent artificial agglomeration during measurement and minimize hydrolysis risk
Measuring Sulfide Samples’ PSD via Wet Dispersion
Three sulfide electrolyte samples were analyzed, each sourced from different application processes within the same manufacturing line. The Bettersizer 2600 Plus was equipped with a BT-812 automatic wet dispersion unit accessory integrated within the inert-atmosphere glovebox previously described.
A BT-812 automatic wet dispersion unit was used to ensure stable particle separation during measurement and prevent moisture-induced degradation. The measurement procedure used for all sulfide samples is summarized in Table 1.
Table 1. Measuring Procedure for Sulfide Samples. Source: Bettersize Instruments
| Procedure Step |
Parameter |
Value/Condition |
| Sample Preparation |
Sample amount |
0.5 mL |
| Pre-test treatment |
Pre-dispersion in selected dispersion medium. |
| Dispersion |
Circulation speed |
n-heptane |
| Ultrasonication |
1200 rpm |
| Ultrasonication |
35 W power, 120 s duration, measurements performed with applied ultrasonication |
| Measurement |
Optical model |
Mie |
| Particle refractive index (RI) |
1.52 |
| Particle absorption rate (AR) |
0.1 |
| Medium RI |
1 |
| Target obscuration range |
8 % - 11 % |
| Measurement repetitions |
6 repetitions |
Each sample was measured a total of six times to assess repeatability. The relative standard deviation (RSD) was also calculated to quantify the stability and consistency of the results.
Measuring PSD of Halide Samples Using Dry Dispersion
Three halide samples were measured using the Bettersizer 2600 Plus particle size analyzer with the glovebox setup. These samples were from different manufacturers. The analysis was completed as previously discussed, with a BT-912 automatic dry dispersion unit. Table 2 shows the measuring procedure employed.
Table 2. Measuring Procedure of Halide Samples. Source: Bettersize Instruments
| Procedure Step |
Parameter |
Value/Condition |
| Sample Preparation |
Sample Amount |
2 - 5 g |
| Pre-test Treatment |
None; sample added directly to the funnel of BT-912 using a spoon. |
| Dispersion |
Feeding Rate |
11 |
| Feeding Height |
2.1 mm |
| Dispersion Pressure |
0.4 MPa |
| Dispersion Medium |
Nitrogen |
| Measurement |
Optical Model |
Mie |
| Refractive Index (RI, particle) |
1.52 |
| Absorption rate (AR, particle) |
0.1 |
| RI (medium) |
1 |
| Target Obscuration Range |
5 % - 10 % |
| Measurement Repetitions |
6 repetitions |
Each sample was measured a total of six times to assess repeatability. The relative standard deviation (RSD) was also calculated to assess the PSD results’ stability and consistency.
Results and Discussion
Case Study 1: Sulfide Electrolytes (Wet Dispersion)
Three sulfide electrolyte samples from different production processes were analyzed to assess their suitability for different battery-cell layers. The Bettersizer 2600 Plus measurements (Figure 3 and Table 3) revealed distinct structural characteristics and particle size distributions for each of the samples.
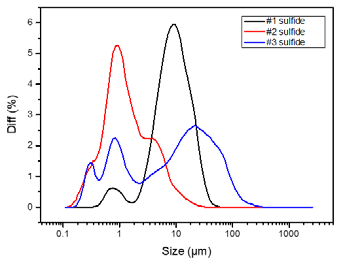
Figure 3. Particle size distribution of the three sulfide samples. Image Credit: Bettersize Instruments
Table 3. D10, D50 and D90 values of the three sulfide samples. Source: Bettersize Instruments
| Stage |
D10 (LD, μm) |
D50 (LD, μm) |
D90 (LD, μm) |
| #1 sulfide |
3.205 |
8.350 |
19.23 |
| #2 sulfide |
0.404 |
1.111 |
4,930 |
| #3 sulfide |
0.496 |
9.711 |
54.96 |
The Bettersizer 2600 Plus’s high-resolution optics revealed clear differentiation between the samples, including considerable structural differences that basic statistical metrics alone would fail to capture.
The PSD differences were interpreted as follows.
Sample One: Suitable for Separator Applications
Sample one exhibits a fairly coarse and uniform distribution (D50 ∼ 8.4 μm) and features minimal fines (D10 > 3 μm). This profile would be well suited to use as a bulk separator layer where larger grains help to lower grain-boundary density, potentially improving flowability during manufacturing and enhancing intrinsic ionic conductivity.
Sample Two: Optimized for Cathode Composites
Sample two exhibits a much finer and more tightly distributed PSD (D50 ∼ 1.1 μm), resulting in an extremely specific surface area. This facilitates intimate contact with cathode active materials (for example, NCM and LFP), improving electrochemical performance and supporting a reduction in interfacial impedance.
Sample Three: Detection of a Problematic Batch
Sample three exhibits a similar median size to sample one, but its PSD highlights the presence of a notable ‘coarse tail’ extending beyond 50 μm. These large particles create mechanical stress points in a typical 30–50 μm solid electrolyte layer, potentially puncturing the electrolyte and risking a short circuit.
Quality control and batch acceptance are highly reliant on the ability to identify these types of ‘failed batch,’ which may be missed due to samples one and three sharing the same chemistry.
Repeatability Evaluation
Each sulfide sample was analyzed six times to verify the robustness of the measurements acquired via the Bettersizer 2600 Plus within the inert-atmosphere glovebox environment. The Relative Standard Deviation (RSD) was calculated for D10, D50, and D90.
Table 4. Repeatability (%RSD) Across Six Runs. Source: Bettersize Instruments
| |
%RSD D10 |
%RSD D50 |
%RSD D90 |
| #1 sulfide |
1.24 |
0.95 |
1.86 |
| #2 sulfide |
0.69 |
0.67 |
0.98 |
| #3 sulfide |
0.24 |
0.55 |
0.67 |
The Bettersizer 2600 Plus was able to deliver RSD values below 2 % across all size metrics. This is in spite of the operational complexity of performing PSD analysis within an oxygen- and moisture-free glovebox, and the complications arising from the handling of anhydrous solvents and pressurized inert gas.
The repeatability requirements of ISO 13320 generally allow 3-5 % variation, meaning that this result proves that glovebox integration does not compromise measurement stability or data accuracy.
Case Study 2: Halide Electrolytes (Dry Dispersion)
Three commercial halide electrolyte materials from different suppliers were evaluated to benchmark variability in PSD control and synthesis quality across the market. Figure 4 shows the resulting PSD curves, while Table 5 shows key particle-size l values.
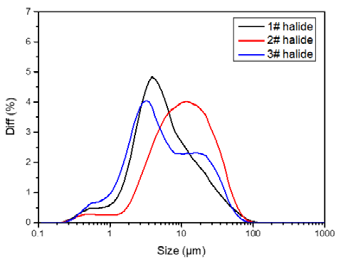
Figure 4. Particle size distribution of the three halide samples. Image Credit: Bettersize Instruments
Table 5. D10, D50, and D90 values of the three halide samples. Source: Bettersize Instruments
| |
D10 (LD, μm) |
D50 (LD, μm) |
D90 (LD, μm) |
| #1 halide |
1.584 |
4.726 |
20.55 |
| #2 halide |
2.719 |
9.874 |
30.54 |
| #3 halide |
1.093 |
3.888 |
22.58 |
Benchmarking Supplier Variability
Analysis of the characteristic size values and PSD curves highlight clear differences in terms of product consistency among the suppliers.
Stable, Controlled Production (Samples Two and Three): Samples one and two were from a stable, controlled production environment. In this case, samples from Supplier A and Supplier B exhibited clean and unimodal PSDs.
- Supplier A offers a fine-grade electrolyte (D50 ∼ 4.7 μm).
- Supplier B provides a coarse grade (D50 ∼ 9.9 μm).
The distributions are smooth and well-controlled in both instances, indicating stable synthesis methods and consistent crystallization or milling processes.
Quality Risk Identified (Sample Three): While the statistical values for sample three appear similar to those of sample one, the full PSD curve (Figure 4) highlights a pronounced ‘shoulder’ defect, signifying the presence of a secondary mode. This bimodal distribution implies a degree of instability in Supplier C's process, potentially including inadequate mixing, inconsistent milling, or uncontrolled crystallization.
These types of variability introduce additional risk for battery manufacturers, especially in applications reliant on highly uniform particle packing. Sample three would be classified as a ‘Grade B’ material in this context, versus the more stringently controlled products sourced from Suppliers A and B.
Repeatability Assessment
Each halide sample was measured six times under dry dispersion conditions in order to assess repeatability. The Relative Standard Deviation (RSD) for D10, D50, and D90 was also calculated to evaluate analytical precision.
Table 6. Repeatability% (RSD) Across Six Runs for Halide Samples. Source: Bettersize Instruments
| |
%RSD D10 |
%RSD D50 |
%RSD D90 |
| #1 halide |
0.13 |
1.05 |
0.88 |
| #2 halide |
0.01 |
0.04 |
0.07 |
| #3 halide |
0.08 |
0.48 |
0.02 |
Dry-dispersion measurements produced RSD values that were consistently ≤ 1.0 % across all three samples. This highlights excellent repeatability and confirms:
- The BT-912 dry-dispersion system’s high mechanical stability
- The Bettersizer 2600 Plus’s optical performance and precision
- The glovebox environment’s effectiveness in maintaining contamination-free and stable measurement conditions
The system considerably outperformed the repeatability requirement of ISO 13320, which generally specifies allowable variation of < 3 %. This was achieved even with operational complexities such as the handling of reactive materials and the use of purge cycles, confirming that leveraging inert-atmosphere isolation results in no compromise to data integrity.
Conclusion
The commercialization of All-Solid-State Batteries (ASSBs) requires strict control of moisture-sensitive electrolytes. The Bettersizer 2600 Plus Glovebox System is ideally suited to this critical step, delivering powerful laser diffraction analysis within a completely protected inert environment.
This integrated approach delivers three notable advantages:
- Safety: It ensures complete protection for both sensitive materials and operators by suppressing hazardous gas generation (for example, H2S) and preventing hydrolysis.
- Insight: The system facilitates precise differentiation between application-specific electrolyte grades (for instance, cathode-compatible versus separator-compatible), revealing hidden structural defects like secondary peaks or agglomerates.
- Control: By delivering highly repeatable PSD measurements (< 1 % RSD), it ensures consistent batch-to-batch performance and supporting reliable high-throughput quality control.
Implementing this integrated glovebox-laser diffraction system empowers manufacturers to ensure electrolyte uniformity, strengthen supply chain robustness, and optimize electrochemical performance, expediting the deployment of safer, higher-energy density solid-state battery technologies.
Acknowledgments
Produced from materials originally authored by Zhichao Han and Weichen Gan from Bettersize Technologies.

This information has been sourced, reviewed and adapted from materials provided by Bettersize Instruments.
For more information on this source, please visit Bettersize Instruments.