Grain size (or particle size) of sediments is an essential parameter in enabling the interpretation of sediment transport, depositional processes, and environmental change in coastal, fluvial, and marine systems.
This article outlines how sediment particle size distributions (PSDs) can be measured, classified, and reported using contemporary laboratory methods. It also presents a range of practical strategies for the integration of fine and coarse fractions, as well as offering reporting guidelines designed to support consistent, clear, and comparable PSD datasets for sedimentary analysis.
Grain particle size distributions (PSDs) underpin the reconstruction of depositional environments, the dynamics of sediment transport, and post-depositional modification across deltas, rivers, coastal zones, deep-water systems, and continental shelves.
A range of surface processes is controlled by how sediment of varying grain sizes is transported, sorted, and ultimately deposited. These include shoreline evolution, delta growth, channel migration, and shelf sedimentation (Figure 1).
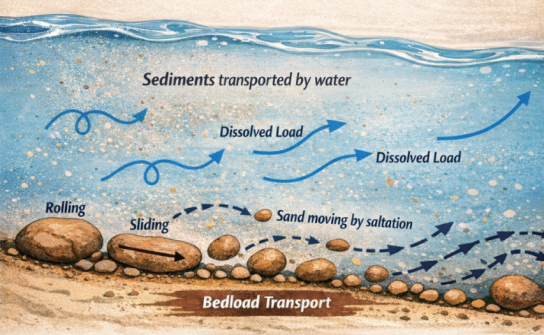
Figure 1. Schematic depiction of sediment transport modes in riverine or coastal settings. Image Credit: Bettersize Instruments
Sediments act as natural archives in unconsolidated systems, recording environmental conditions and depositional energy. A sample’s PSD reflects interactions between transport capacity, sediment supply, and local hydrodynamic conditions.
For instance, well-sorted and coarser sands generally form in higher-energy environments such as channel bars and surf zones, while poorly sorted and finer muds typically indicate low-energy settings like estuaries, distal shelves, or lacustrine environments.
Translating these conceptual relationships into laboratory PSD measurements of natural sediments commonly presents challenges such as:
- Exceptionally broad size ranges, from sub-micron clay to centimeter-scale shell and gravel material.
- Diverse grain shapes and mineralogy, including elongate heavy minerals, platy mica, and angular lithic fragments.
- Methodological inconsistencies stemming from a long history of conventional approaches (for example, pipetting, sieving, and hydrometers) and contemporary optical techniques (such as laser diffraction and imaging), which do not always generate numerically equivalent results.
To address these challenges, contemporary laboratory workflows must carefully integrate grain size classification, precise measurement techniques, and standardized data reporting.
Grain Size Classification Systems
The Wentworth Scale
The Wentworth scale is generally used to categorize sediments. The scale divides particles into gravel, sand, silt, and clay based on their diameter:1
- Gravel: 2 mm to 64 mm
- Sand: 0.0625 mm (1/16 mm) to 2 mm
- Silt: 0.0039 mm (1/256 mm) to 0.0625 mm
- Clay: < 0.0039 mm (1/256 mm)
These categories represent the foundation of sedimentological description and see routine use in engineering applications, depositional facies analysis, and environmental assessments.
The Phi Scale
Sedimentologists frequently use the phi (φ) scale when finer resolution within the Wentworth framework is needed. This base-2 logarithmic transformation of grain diameter was introduced by Krumbein.2
The phi scale is referenced to 1 mm and expresses grain size in powers of two. The phi value is related to grain diameter (d, in mm) by the expression:
φ = −log2 (d/D0)
Here, d is the grain diameter, while D0 is 1 mm. This transformation converts the Wentworth scale into simple whole-number intervals, making grain-size data easier to accommodate in graphical and statistical analysis.
Increasingly positive φ values correspond to progressively finer grain sizes than 1 mm, while increasingly negative φ values correspond to progressively coarser grain sizes.
The phi scale offers a range of benefits, including:
- A uniform logarithmic axis for plotting PSDs
- Support for widely used statistical descriptors such as sorting, skewness, the Folk and Ward mean, and kurtosis.3
- Easier comparison across historical and current datasets.
Recommended Measurement Techniques
Particle size analysis methods report an equivalent diameter, as opposed to the true three-dimensional geometry of each grain. This distinction is essential for natural sediments, which are typically mixtures of platy minerals, angular fragments, shell debris, and aggregates.
The most widely used PSD techniques and their operational characteristics are summarized in Table 3.1. Each technique defines particle size differently, meaning that PSDs measured using different instrument methods will not be numerically identical. Laboratories generally choose the method best suited to their material type, size range, and workflow.
Table 3.1. Common techniques for particle size analysis of sediments. Source: Bettersize Instruments
| Technique |
Typical Size
Range |
Size
Definition |
Typical
basis |
Sample
State |
Typical Run
Time |
| Sieving |
63 μm -
125 mm |
Sieve-aperture
passing size |
Mass |
Usually dry |
15-20 min |
| Sedimentation |
1 μm -
63 μm |
Stokes equivalent
sphere diameter |
Mass |
Suspension |
tens of min
to hours |
Laser
diffraction |
0.02 μm -
2000 um |
Volume-equivalent
sphere diameter |
Volume |
Wet or dry |
1 min |
Optical
microscopy |
30 μm -
several mm |
2D projected
size |
Number |
Usually dry |
variable
(count-based) |
Sieving
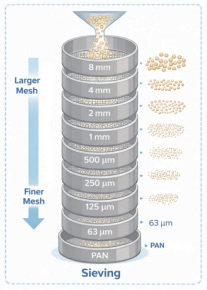
Figure 2. Typical sieving workflow for sediment analysis. Image Credit: Bettersize Instruments
Mechanical sieving separates grains according to their ability to pass through a stack of sieves. These sieves are arranged from coarse to fine, for example, 8 mm, 4 mm, 2 mm, 1 mm, 500 µm, 250 µm, 125 µm, and 63 µm.
Once shaking is complete, a recording is taken of the mass retained on each sieve and the percentage by mass in each size class is expressed as a percentage of the total sample mass. This value allows a PSD to be calculated.
The reported diameter corresponds to the minimum grain dimension able to pass through the sieve opening.
Sieving is most effective for the coarse fraction of sediment, with typical applications including:
- Dune and beach sands
- Bar and channel gravels
- Shell sediments and marine aggregates
- The sand- and gravel-portion of mixed samples
Sediment is dry-sieved down to a defined cut-off (for example, 1 mm) in many marine and coastal workflows, with finer material analyzed using laser diffraction or another technique. The fine and coarse datasets are later merged.
Sedimentation
Sedimentation methods determine grain size from particles’ settling behavior in a fluid column. Small particles settle according to Stokes’ law when under laminar flow, with settling velocity depending on density contrast, diameter, and fluid viscosity.
The cumulative proportion finer than a given Stokes-equivalent diameter can be derived by tracking density or mass over time.
The pipette method sees aliquots withdrawn from a fixed depth at predetermined times. These aliquots are then dried and weighed to quantify the fine fraction remaining in suspension.
The hydrometer method sees a hydrometer utilized to measure changes in suspension density as particles settle. It is then possible to convert these readings to a cumulative PSD.
Both methods require careful control of temperature, dispersion, and fluid properties if reliable results are to be ensured.
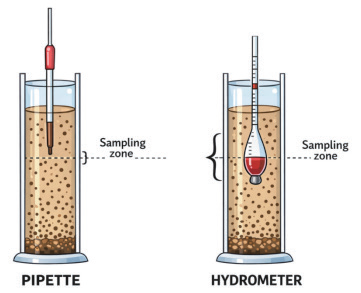
Figure 3. Schematic comparison of pipette and hydrometer sedimentation methods. Image Credit: Bettersize Instruments
Sedimentation methods have long been employed in the analysis of fine-grained sediments, especially cohesive mud. Sedimentation methods continue to see routine use, with applications including:
- The reproduction of legacy datasets initially obtained by hydrometer or pipette
- The focused study of very fine silt and clay
- Use in laboratories optimized for conventional sedimentation workflows
Several modern coastal and marine laboratories have migrated to laser diffraction for the fine fraction due to higher throughput requirements and the need for continuous PSD output, but sedimentation methods continue to function as useful reference techniques.
Laser Diffraction
Laser diffraction is usually performed in wet dispersion in sediment applications. This involves suspending the sediment sample in a liquid and circulating this through a measurement cell to maintain a representative particle population.
A laser beam passes through the flowing suspension, allowing the scattered light pattern to be recorded. Here, finer particles scatter at wider angles and coarser particles scatter at small angles.
An optical model (Fraunhofer or Mie) is then used to calculate particle size distribution (PSD) from this scattering pattern.
The technique provides repeatable, rapid measurements. It sees routine in depositional analysis, sediment transport, and routine laboratory workflows.
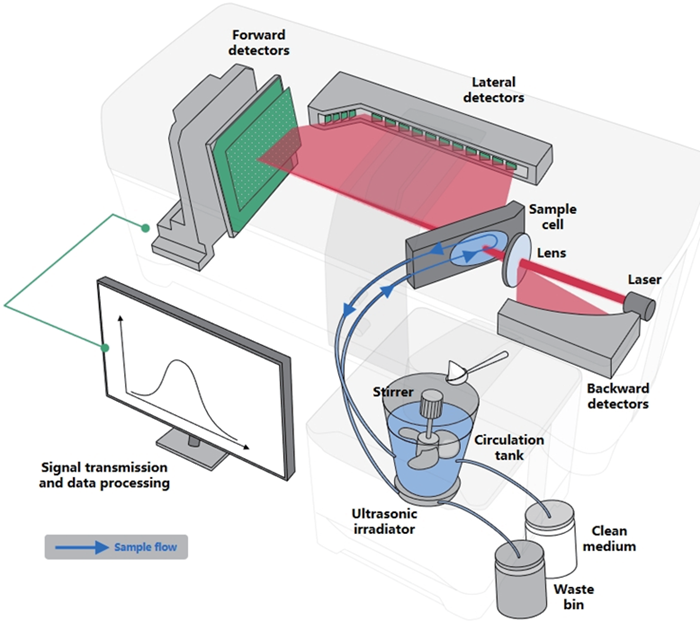
Figure 4. Working principle of a wet-dispersion laser diffraction system. Image Credit: Bettersize Instruments
Laser diffraction is increasingly utilized in the characterization of:
- Subtidal and intertidal sediments from sands to muds
- Deltaic, estuarine, and continental shelf deposits
- Suspended sediment collected from estuaries, rivers, and coastal waters.
A common laboratory workflow includes the following steps:
- Pre-treatment of the sediment, for example, via desalination, the removal of organics or carbonates in line with approved protocols.
- Where required, wet sieve the sample to remove coarse material, for instance, 2 mm.
- Disperse the fine fraction using ultrasonication and/or chemical dispersants.
- Measure PSD via wet laser diffraction, generally with replicate runs.
Field applications of this process include the use of in situ laser diffraction sensors deployed in estuaries, rivers, and coasts to deliver the near-real-time particle size measurements required to support the study of resuspension events, suspended sediment dynamics, and turbidity processes.4
Optical Microscopy
Optical microscopy and image-based particle analysis work by acquiring two-dimensional images of sediment grains. These are either acquired as static mounts or as particles passing through a flow cell (Figure 5).
Image-processing algorithms enable the identification of individual grains and the calculation of size and shape metrics, including:
- Equivalent circular diameter based on projected area
- Minimum and maximum Feret diameters
- Roundness, aspect ratio, and related shape descriptors
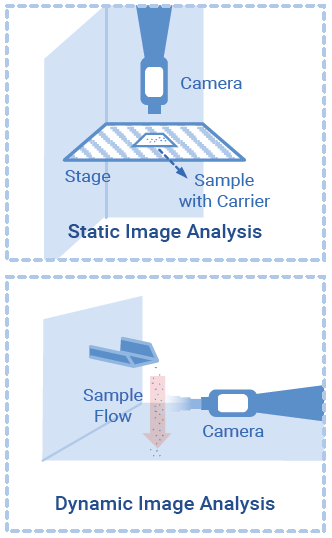
Figure 5. Static and Dynamic imaging configurations for sediment grain analysis. Image Credit: Bettersize Instruments
Image-based methods are especially valuable in cases where:
- The coarse fractions (for example, shell fragments, sand, or gravel) are of primary interest
- Grain shape and angularity are required to interpret transport history or abrasion
- There is a need for visual confirmation of large particles or specific grain types
Image analysis is typically combined with other PSD techniques (for example, sieving or laser diffraction) to provide the targeted verification of specific size classes and complementary grain-shape information.
Data Integration and Standardization
No single measurement technique can effectively capture the entire range of particle sizes observed in natural sediments. Laboratories generally address this diversity by combining methods to acquire a complete PSD.
One common workflow involves a combination of:
- Dry sieving for the gravel and sand fraction above a chosen cut-off
- Wet laser diffraction for the finer fraction below that cut-off
Several steps are important when merging these outputs into a single, coherent PSD.
Defining the Cut-Off Size and Splitting Method
It is essential to divide the bulk sample in a reproducible way at the selected boundary (for instance, 1 mm). The coarse fraction then proceeds to sieving, while the fine fraction proceeds to laser diffraction. Consistency across samples can be assured through clear documentation of the cut-off sieve and any wet-sieving procedures.
Normalizing Datasets Back to a Common Basis
Sieving reports mass fractions while laser diffraction generally reports volume-based PSDs, meaning that it is necessary to normalize both datasets back to a consistent reference, typically total sample mass. This step ensures that the true proportions of fine and coarse material are accurately reflected by merged PSD.
Constructing a Unified PSD from Complementary Size Domains
The final cumulative PSD should integrate laser-derived size classes for fine grains and sieve-derived size classes for coarse grains.
This ‘split-and-merge’ approach leverages each technique’s strength while minimizing the limitations typically associated with any single method.
Conclusion
Grain size is one of the most useful and informative descriptors of sedimentary materials, offering insights into depositional environments, transport processes, and post-depositional modification.
The reliability of PSD data is dependent on how measurements are performed, interpreted, and reported, however.
Methods such as sedimentation, sieving, laser diffraction, and image analysis are only able to deliver high-quality results when samples are appropriately pre-treated and dispersed and instruments are properly configured.
Meaningful comparison among datasets or between laboratories requires clear reporting of:
- The diameter definition employed
- The reporting basis
- The sample preparation and dispersion steps applied
- Any method-specific assumptions deemed relevant to interpretation
A split-and-merge workflow remains an efficient strategy where wide particle size ranges are required, as long as the normalization, cut-off, and potential sources of uncertainty are clearly documented.
Transparent methodology and consistent reporting ensure that PSDs become a robust foundation for interpreting depositional processes, sediment dynamics, and environmental change.
References and Further Reading
- Wentworth, C.K. (1922). A Scale of Grade and Class Terms for Clastic Sediments. The Journal of Geology, 30(5), pp.377–392. DOI: 10.1086/622910. https://www.journals.uchicago.edu/doi/abs/10.1086/622910.
- Krumbein, W.C. (1934). Size frequency distributions of sediments. Journal of Sedimentary Research, (online) 4(2), pp.65–77. DOI: 10.1306/D4268EB9-2B26-11D7-8648000102C1865D. https://pubs.geoscienceworld.org/sepm/jsedres/article-abstract/4/2/65/96255/Size-frequency-distributions-of-sediments.
- Folk, R.L. and Ward, W.C. (1957). Brazos River bar (Texas); a study in the significance of grain size parameters. Journal of Sedimentary Research, (online) 27(1), pp.3–26. DOI: 10.1306/74d70646-2b21-11d7-8648000102c1865d. https://pubs.geoscienceworld.org/sepm/jsedres/article-abstract/27/1/3/95232/Brazos-River-bar-Texas-a-study-in-the-significance?redirectedFrom=PDF.
- Bettersize Instruments Ltd. (2025). DeepSizer 300 for Immediate Sediment Response in Extreme Hydrological Conditions.Knowledge Center Detail - Bettersize. (online) Available at: https://www.bettersizeinstruments.com/learn/knowledge-center/deepsizer-300-for-immediate-sediment-response-in-extreme-hydrological-conditions/.
Acknowledgments
Produced from materials originally authored by Perfil Liu from Bettersize Technologies.

This information has been sourced, reviewed and adapted from materials provided by Bettersize Instruments.
For more information on this source, please visit Bettersize Instruments.