A single frequency oscillation test at constant stress is used to measure structure rebuild after a pre-shear.
The pre-shear is normally a constant shear rate. The value is determined directly from the simulated process or the limiting high shear region of the flow curve. The required pre-shear time can be obtained from running a constant shear rate test and plotting viscosity against time, as shown below. When the viscosity reaches a plateau, this time can be used in the pre-shear.
The viscometry results show that the time taken for the structure to be fully broken down is c.40 seconds.
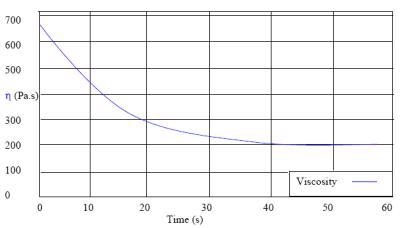
Figure 1. Viscosity measurements used to quantify thixotropy of a coating material.
An amplitude sweep is performed as a precursor experiment to the single frequency rebuild test, enabling the 'linear value' of the modulus to be determined.
This modulus is representative of the fully structured sample. Comparison of the linear modulus with the rebuilding modulus provides a convenient method of determining the extent of structure recovery.
Interpretation
In the oscillation rebuild experiment, the structure rebuilds during the test before reaching a plateau where it has fully recovered. The crossover point of the elastic and viscous moduli indicates when the structure becomes predominantly elastic and this can be used as an indication of a weak gel structure forming.
Formulations with an earlier crossover may therefore show reduced sagging, whereas a later crossover would give better leveling characteristics.
Conclusion
The thixotropic nature of a coating can be accurately quantified, so a suitable pre-shear and equilibrium time can be used in subsequent tests; the equilibrium time can be taken from the total rebuild time, which in this case is 600 seconds.
This will then allow all samples to be assessed either after they have fully recovered, or at least with the same 'shear history', allowing comparable and reproducible results. Also, the microstructure of the material can be probed with oscillation measurements and so the mechanism of thixotropic rebuild can be clearly seen.
Measurement Conditions
| Samples |
Coatings |
| Geometry |
Cone and plate system 4o/ 40 mm with a solvent trap |
| Temperature |
25oC |
| Pre-Shear |
| Shear rate |
500s-1 |
| Shear time |
30 seconds |
| Equilibrium time |
2 seconds |
| Single Frequency Oscillation |
| Stress |
0.1 Pa |
| Frequency |
1 z |
.png)
This information has been sourced, reviewed and adapted from materials provided by Malvern Panalytical.
For more information on this source, please visit Malvern Panalytical.