A paint or pigmented coating is basically a dispersion of pigment particles in a fluid matrix. Most dispersion Manufacturers realize that success or failure of a product is dependent on properties such as the storage stability, sag resistance, good leveling, brushing and spraying.
These factors are often in conflict with one another and so to produce a successful product, a balance must be obtained. Measurement of the rheological properties can provide micro structural information, enabling a better understanding of the application and end use characteristics. One of the best techniques for determination of sample microstructure is oscillation (dynamic) testing.
Linear Viscoelastic Region (LVER)
Before making detailed dynamic measurements to probe the sample’s microstructure, the linear viscoelastic region (LVER) must first be defined. This is determined by performing an amplitude sweep. As discussed previously, the LVER can also be used to determine the stability of a suspension. The length of the LVER of the elastic modules (G') can be used as a measurement of the stability of a sample's structure, since structural properties are best related to elasticity. A sample that has a long LVER is indicative of a well-dispersed and stable system. From the amplitude sweep test, a stress or strain must be selected from the LVER and incorporated into subsequent oscillation measurements.

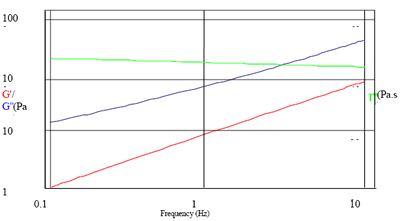
Figure 1. Non-associated particulate dispersion with viscosity almost independent of frequency.

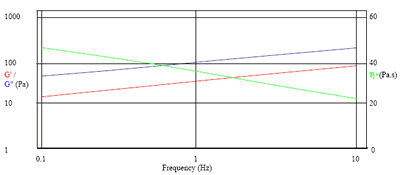
Figure 2. Weakly- structured system with viscous modulus dominant over the elastic modulus.

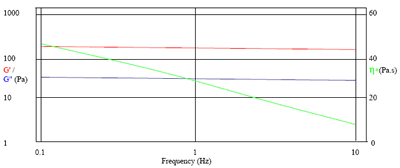
Figure 3. A well-structured (gelled) system.
Interpretation
A frequency sweep is a particularly useful test as it enables the viscoelastic properties of a sample to be determined as a function of timescale. Several parameters can be obtained, such as the Storage (Elastic) Modulus (G'), the Viscous (Loss) Modulus (G"), and the Complex Viscosity (η*).
The storage modulus can be used as a measure of the elastic component of the sample and similarly, the loss modulus – the viscous component of the sample.
Whichever modulus is dominant at a particular frequency will indicate whether the fully structured material appears to be elastic or viscous, in a process of similar time scale. The mechanical response of most dispersion coatings is viscoelastic, since the presence of suspended solids, high additive concentrations, colloidal thickeners, etc. will induce some sort of structure upon the bulk phase. Some examples are considered in the following frequency sweep data sets.
Figure 1 is typical of a non-associated particulate dispersion and the viscosity is almost independent of frequency. The viscous modulus is dominant over the elastic modulus and both of these are highly dependent on frequency. In this situation, sedimentation is likely to occur.
Figure 2 shows a weakly- structured system. The viscous modulus will still dominate over the elastic modulus. However, the difference between these is less great than in the non-associated system. The complex viscosity is also now dependent on the frequency. In this system sedimentation may occur.
Figure 3 shows what could be classified as a well-structured (gelled) system. In this case particles are strongly associated, the storage modulus (G') is greater than the loss modulus (G") and both are almost independent of frequency. Sedimentation is unlikely to occur.
Conclusion
The degree of dispersion and interparticle association can be clearly seen from the profile of the frequency sweep data.
Where a pigment or thixotrope needs to be well dispersed into a fluid matrix, the process can be optimized by sampling and running repeated frequency sweep tests. The fully dispersed sample will give the most gelled system. Similarly, the effectiveness of surfactants and other colloidal thickeners can be quantified in situ.
The frequency sweep curve gives a good rheological description of how the product will behave during storage and application.
Measurement conditions:
Samples: any dispersion system used for coating
Geometry: Cone and plate system 4º/40 mm with a solvent trap
Temperature: 25ºC
Frequency sweep: 10 - 0.l Hz
Strain: 0.010

This information has been sourced, reviewed and adapted from materials provided by Malvern Panalytical.
For more information on this source, please visit Malvern Panalytical.