It is a well known fact that nuclear magnetic resonance (NMR) is commonly used in well logging measurements and for routine laboratory core analysis. However, many are not aware of the principle behind NMR and its advantages for the core analyst. It is commonly used to determine porosity and pore size distributions but it is important to note that NMR can also measure fluid mobility parameters such as bound volume irreducible (BVI), free fluid index (FFI), clay bound water (CBW) and effective porosity.
NMR can also easily and effectively measure permeability, capillary pressure, and oil/water and gas/water contents. These parameters are measured with high level of precision using comprehensive software, which is user-friendly and can be easily operated by a novice in NMR. The technical details given below are aimed at introducing NMR to the petrophysicist and core analyst who are not very familiar with NMR.
Technical Background
When a sample is placed in a magnetic field and activated with a quick pulse of radio frequency (RF), NMR signals are generated from liquids such as brine or oil. An NMR signal is formed instantaneously after the pulse, which then dies away with a characteristic decay rate or relaxation time known as T2. The signal amplitude immediately after the pulse indicates the total amount of fluid present. T2 of the signal provides important information about the physical environment of the liquids.
In pores filled with a single fluid, there are two key components to the NMR signal, one signal is generated from the fluid far from the pore walls and another close to the pore walls. The nature of NMR signals in fluids far from the pore walls is similar to those from bulk fluids having comparatively long relaxation times, whereas fluids close to the pore walls undergo a process of adsorption and desorption with the pore walls which has the effect of drastically reducing their NMR relaxation times.
In large pores, the dominant effect is from the bulk fluids, so larger pores have longer NMR relaxation times. In smaller pores, the surface-to-volume ratio is much higher, hence the fluids near the pore wall dominate the NMR signal, and smaller pores display overall shorter NMR relaxation times. This process is illustrated in the figures below.
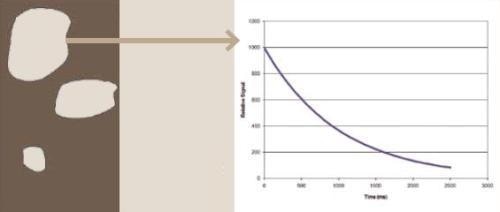
Fluids in large pores have long T2 decay times, like bulk fluids
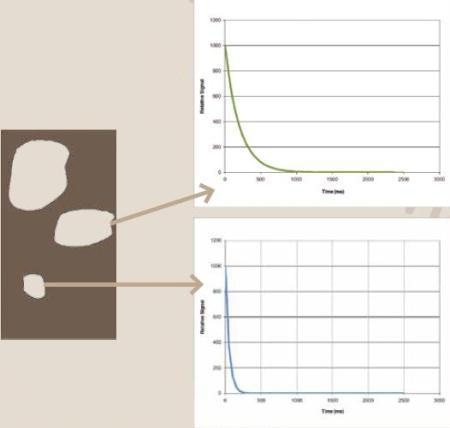
Signals from fluids in smaller pores are modified by surface interactions
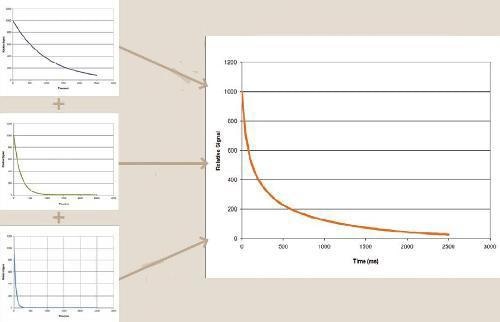
Of course, practically it may not feasible to take NMR measurements from individual pores. The entire core must be measured at once, hence the resulting NMR signal is a composite of all the NMR signals from the different pore sizes in the core.
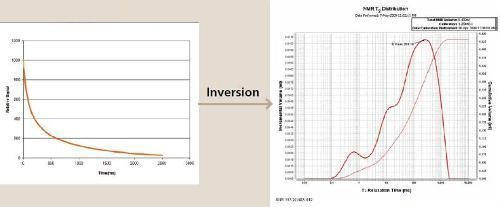
Mathematical Procedure - Inversion
Inversion is a mathematical procedure that involves processing the composite NMR signal and separating it into its components. For every different pore size in the core, there is one T2 component. Practically, the analysis is restricted to a maximum of about 256 individual T2 components. A T2 distribution is obtained which shows the relative population of the individual T2 decay times that make up the composite NMR signal from the core. Since long T2s come from large pores, and short T2s from small pores, this T2 distribution can also be considered as a model of the pore size distribution in the core.
Useful Measurements – Porosity, BVI, FFI, CBW and Permeability
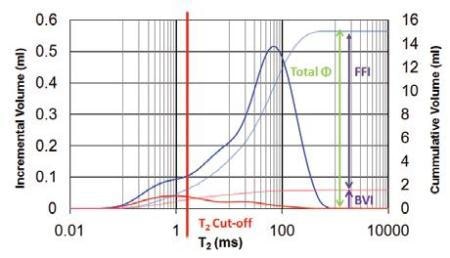
After obtaining the basic pore size distribution from the NMR data, a number of helpful petrophysical parameters are conveniently and rapidly inferred. The total porosity is the integral of all the T2s which is the area under the curve when compared to the signal from a known reference.
In case the core is centrifuged the NMR measurement is repeated, the integral of the second data set is the irreducible fluid (BVI), while the difference between the two is the Free Fluid Index (FFI).
It is essential to note that the area under the saturated T2 distribution curve, which gives us a measure of total porosity, is influenced by the curve shape. In case, the T2 curve does not represent all the T2s present in the sample, then there will be some missing signals from certain pores which will result in porosity being under reported. This is possible if the instrument being used is not capable of detecting short T2 signals from small pores, which would result in small pores not being accounted for. The instrument being used must be able to perform sustained measurements using short time-to-echo (TE) values.
This effect is shown in the following figure, which shows three T2 distributions obtained on the same core sample with TE=100μs (green), 200μs (red) and 600μs (blue).
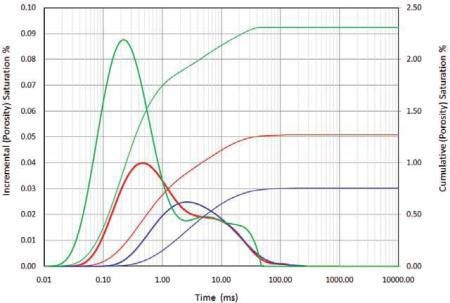
The green distribution line at TE=100 μs and the red distribution line at TE=200 μs are more detailed at the shorter T2 values or the smaller pores than the blue distribution line at TE=600 μs. The total integral signal recorded for the green distribution is considerably higher corresponding to a higher porosity value. The results are shown in the following table.
| Sample |
TE (μs) |
Acquisition Time (min) |
Number of Scans |
Signal to Noise Ratio |
NMR Porosity (ml) |
| 1-4R |
100 |
2 |
80 |
220.18 |
4.248 |
| 200 |
5.5 |
224 |
203.06 |
2.175 |
| 600 |
21.5 |
864 |
200.16 |
1.151 |
It is usually assumed that all T2s of 2.5 ms or below come from clay bound water, which are integrated separately to report CBW, and thence Effective Porosity. Permeability can be determined from the relaxation data using the Schlumberger or Coates model. The LithoMetrix software incorporated in every GeoSpec2 instrument enables the measurements accurately and quickly. An accessory known as pulsed field gradients (pfg) when added to the NMR instrument enables measurements on flow, distribution or diffusion of fluids within core sample.
The other measurements include the following:
- Capillary pressure
- Pore throat distribution
- Wettability
- Fluid typing
Capillary Pressure
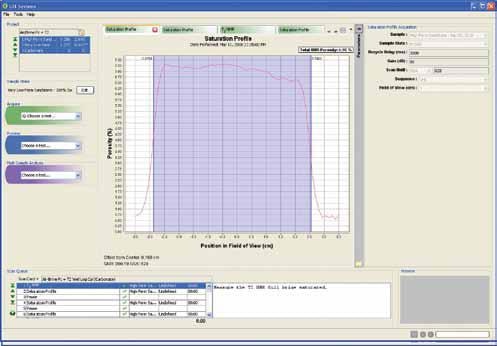
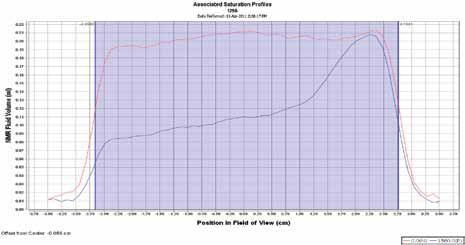
The measurement of capillary pressure, which previously took several weeks to months is now possible with NMR in hours or days with more number of data points. The GeoSpec instrument has a patented GIT-CAP technique, which combines 1-D profiling and conventional centrifuge methods recording NMR signals in a single dimension along the axis of the core. The method involves saturating a core and obtaining a 1-D profile measurement through the NMR instrument. An almost uniform fluid distribution is seen along the core length as shown in the figure below.
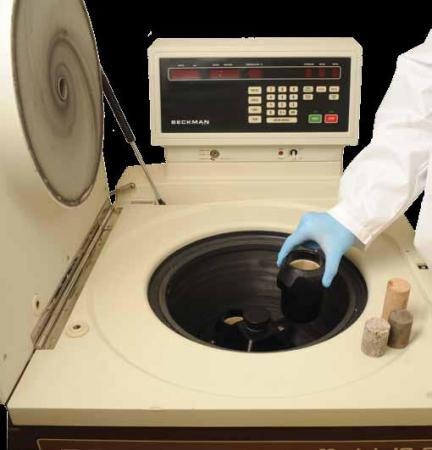
The core is then spun in a standard centrifuge, which enables the fluid to be shifted towards the core outer end and another 1-D profile with 30 – 40 points is obtained.
This process is repeated at another centrifuge spin speed, after which the data is analyzed. The calculation of capillary pressure is based on the knowledge of the centrifuge spin speeds and the changes in the saturation profile.
A number of factors need to be kept in mind, which are listed below:
- It is possible to measure four times more samples than traditional methods as only two centrifuge speeds are required compared to eight previously
- For each saturation profile around 30 to 40 data points are obtained along the sample as compared to one spin speed conventionally
- A standard centrifuge without fluid collection measurement or stroboscope is used.
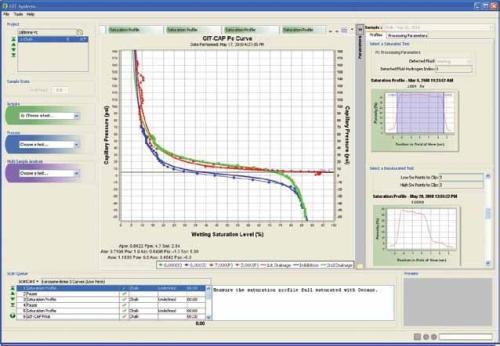
Primary drainage, imbibition, and secondary drainage capillary pressure curve
Pore Throat Distribution and Wettability
The Washburn equations are used to determine pore throat distributions after obtaining the Pc curve. The imbibition and secondary drainage curves generated by the NMR Pc measurement enable prediction of USBM wettability. The calculations are fed into the software and follow as a natural consequence of the NMR Pc Data. An additional advantage is that the NMR measurement is non-destructive and can use reservoir wettability and fluids.
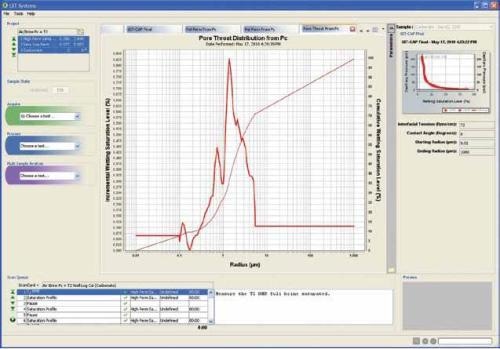
Pore throat distribution obtained from Pc data
Fluid Typing
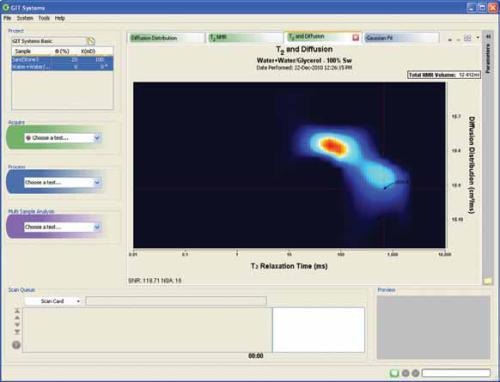
The GeoSpec2 instruments fitted with pulsed field gradients (pfg) can perform measurements that are dependent on the flow, diffusion, or distribution of the fluids within the core sample. One application of this is for fluid typing.
Different fluids such as partially bound water and heavy oils may have similar T2 values but they have different diffusion characteristics hence both diffusion data and T2 need to be collected for accurate separation of the fluid types. These measurements are possible with GIT system software with a pfg accessory.
Conclusions
NMR is now a well-established core analysis tool, capable of making a wide range of core measurements, from pore size distributions to capillary pressure, on a single instrument such as the GeoSpec2. Hitachi High-Tech Analytical Science and Green Imaging Technologies have partnered to enable an integrated hardware and software solution so that a wide range of measurements can be performed with considerable ease, with no specialized knowledge of NMR.

This information has been sourced, reviewed and adapted from materials provided by Oxford Instruments Magnetic Resonance.
For more information on this source, please visit Oxford Instruments Magnetic Resonance.