The Q5800 includes the following:
- Filtration Particle Quantifier (FPQ) Tower that provides abnormal wear metal analysis using XRF technology and particle counting
- Kinematic Viscometer at 40°C, which offers solvent-free measurements of a lubricant’s kinematic viscosity
- Infrared Spectrometer with Flip-Top Cell, which provides tests for TAN/TBN, water content, soot, oxidation and mixed up fluids using infrared technology
Principle of Operation
This section provides the basic operating principles of the Q5800 device by component.
Filtration Particle Quantifier (FPQ) Tower
The Q5800 makes use of a new combination of particle filtration and XRF to assess machine condition by tying the particle count and elemental wear metal distribution in the sample together.
The Filtration Particle Quantifier FPQ is a patent pending device that can obtain an accurate particle count for a given filter size. This can be done by measuring the pressure rise across the filter since the pores get blocked with particles. Unlike conventional “pore blockage” technology, it has a specific measuring range from 2,500 to 1,500,000p/ml.
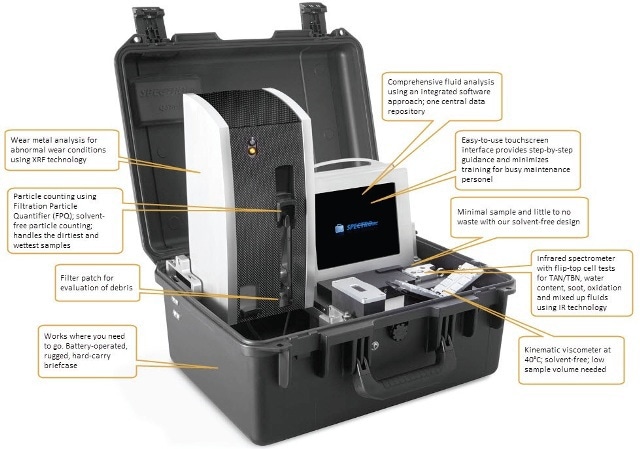
Figure 1. Q5800 components and functions
The device ensures that the particles deposited on the filter reach a maximum level for a given shut off pressure. This pressure is set below the caking region of the filter where “particle swapping” occurs. This ensures that a correct particle deposition and oil volume can be obtained for subsequent XRF analyses.
Once the particle count is complete, the filter slide is transferred to the XRF for analysis where the elemental breakdown of the sample is quantified. This is where the root cause of the failure can be identified and is akin to Ferrography analysis.
Figure 2 shows the tower which encompasses the FPQ and XRF device in the overall oil monitor system. The figure also shows the filter being inserted into the XRF.
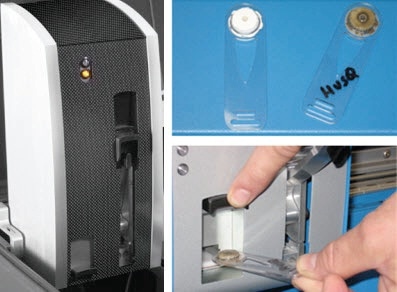
Figure 2. FPQ and XRF tower assembly
Kinematic Viscometer at 40°C - Infrared Spectrometer with Flip-Top Cell
The Q5800 uses the technology from its successful patented wedged IR Spectrometer (FluidScan®) and the Q3000 kinematic viscometer to glean critical oil condition parameters.
Similar to their portable counterparts, both these instruments operate seamlessly without the need for any solvents in the Q5800 enclosure. The results can easily be compared or correlated to a typical lab, reporting viscosity in cSt and IR measurements in ppm, abs/mm2 or abs/cm.
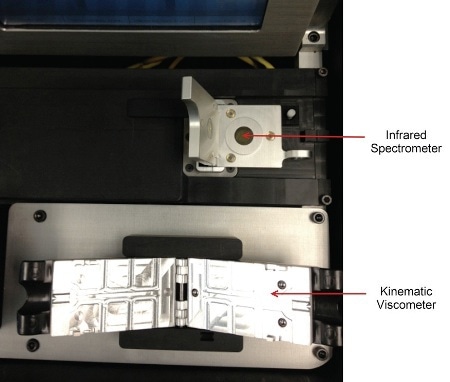
Figure 3. Close-up of IR spectrometer and kinematic viscometer in the Q5800
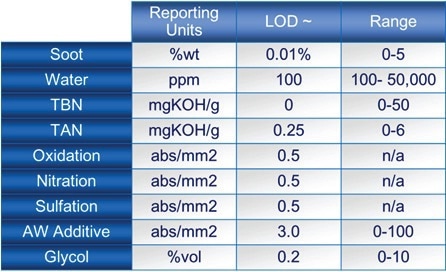
Figure 4. IR properties
Case Study – Real World Sample Testing
LaserNet Fines direct imaging and spectroscopy are popular techniques to quantify particle count and elemental concentration respectively.
Example 1: Marine Engine FPQ/XRF Data Set
The following data set from a series of marine diesel vessels was used to evaluate the FPQ and XRF technology. Samples were analyzed on the FPQ device and XRF and were shown to correlate to LaserNet Fines® and acid digestion using the ICP.
Figures 5 and 6 show how the FPQ and XRF correlate to the LaserNet Fines® direct imaging particle counter.
The data in Table 1 shows a selection of the marine samples that were analyzed on the ICP before and after acid digestion. This method is commonly known as differential acid digestion.
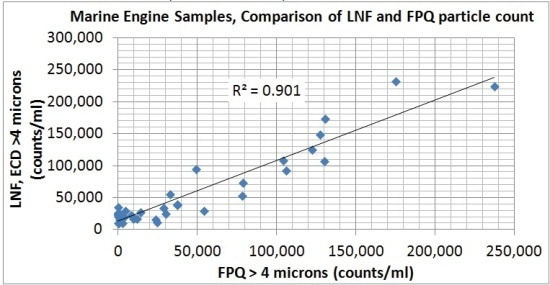
Figure 5. LaserNet Fines® vs. FPQ (counts/ml > 4μm)
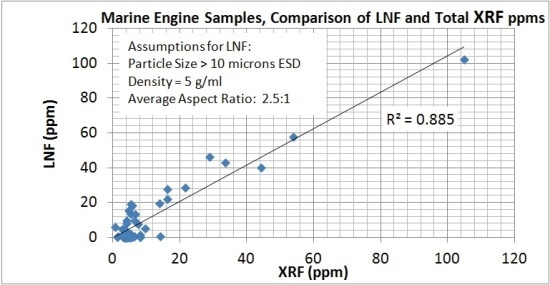
Figure 6. LaserNet Fines® vs. XRF – Total ppms
Table 1.Differential acid digestion sample result (Sample E= 10-1151,Sample F= 10-1149)
| |
Before Acid Digestion - ICP (ppm) |
After Acid Digestion - ICP (ppm) |
| Sample |
A |
B |
C |
D |
E |
F |
A |
B |
C |
D |
E |
F |
| Ag |
0 |
0 |
0 |
0 |
0 |
0 |
0 |
0 |
0 |
0 |
0 |
0 |
| Al |
0 |
0 |
0 |
10 |
10 |
21 |
0 |
0 |
0 |
0 |
13 |
28 |
| Cr |
6 |
0 |
0 |
0 |
6 |
7 |
6 |
0 |
0 |
0 |
6 |
8 |
| Cu |
0 |
0 |
0 |
0 |
11 |
11 |
0 |
0 |
0 |
0 |
10 |
10 |
| Fe |
10 |
7 |
0 |
0 |
33 |
67 |
11 |
10 |
0 |
0 |
35 |
86 |
| Mo |
0 |
0 |
0 |
0 |
0 |
0 |
0 |
0 |
0 |
0 |
0 |
0 |
| Ni |
0 |
0 |
0 |
0 |
0 |
0 |
0 |
0 |
0 |
0 |
0 |
0 |
| Pb |
0 |
0 |
0 |
0 |
0 |
0 |
0 |
0 |
0 |
0 |
0 |
0 |
| Sn |
0 |
0 |
0 |
0 |
0 |
0 |
0 |
0 |
0 |
0 |
0 |
0 |
| Ti |
0 |
0 |
0 |
0 |
0 |
0 |
0 |
0 |
0 |
0 |
0 |
0 |
| V |
0 |
0 |
0 |
0 |
0 |
0 |
0 |
0 |
0 |
0 |
0 |
0 |
| Total ppm |
16 |
7 |
0 |
10 |
60 |
106 |
17 |
10 |
0 |
0 |
64 |
132 |
Figure 7 shows how the differential ICP results (large particles) for samples E and F compare to the XRF data for the same samples. Figure 8 shows the difference in ppms between the ICP and XRF readings for Fe and Al in sample F.
This is an expected result based on how large and small particles behave in a closed loop lubricating system. Based on the density of iron, it would take 100 particles of the illustrated dimensions in 1ml of oil to raise the elemental concentration by just 1ppm.
For lighter metals like aluminum, it would take approximately three times this amount of particles. This explains why the differential elemental ICP and XRF readings are relatively low when compared to the fine and dissolved particle readings using routine spectroscopy. In this example, the Fe and Al is most likely cylinder/piston wear.
This is a common failure mode in this application and shows how the XRF is able to identify root causes of problems.
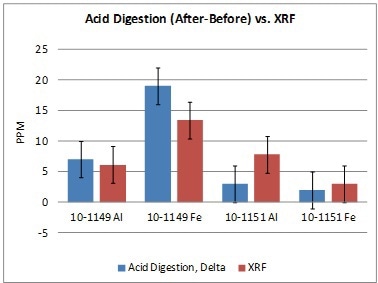
Figure 7. Acid digestion (after – before) vs. XRF
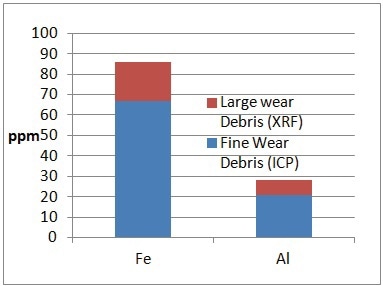
Figure 8. Sample F – fine vs. large particles
Example 2: Wear Progression to Failure
There is always an increase in the rate and size of production of severe wear particles. They are identified as an increase from a known equilibrium level in the system. As abnormal wear progresses, the size and the rate of production of these particles increases until eventually the system fails. Limits based on rate of change apply in this case, but for larger particles measured by FPQ and XRF, a static limit applies after the system reaches equilibrium.
Unlike existing optical particle counter and pore blockage technologies, the FPQ can handle a wide range of applications with relatively high wear rates (up to 1.5 millionp/ml). The following data shows FPQ and XRF data for a wide range of components that are typically found in heavy duty industrial vehicle equipment: engines, transmissions, final drives, and front differentials.
Water and other liquids pass through the polycarbonate filter pores and the results are unaffected. The real particle count in this sample was only ~31kp/ml and the elemental level was low.
Conclusion
The Q5800 is a revolutionary tool that takes oil analysis to the machine using a rugged, portable device equipped with a suite of miniaturized state-of-the-art instrumentation.
The device can precisely quantify both lubricant and machine condition parameters for a variety of assets. Lubricant condition is derived using an established portable IR technique along with a solvent- free kinematic viscosity measurement.
The subsequent elemental concentration from the FPQ filter using XRF analysis correlates well with differential acid digestion.
This combined particle count and elemental concentration can be used to identify changing wear rates and isolate potential root causes of problems in lube systems.

This information has been sourced, reviewed and adapted from materials provided by AMETEK Spectro Scientific.
For more information on this source, please visit AMETEK Spectro Scientific.