Polymers are extensively used throughout industry, whether as naturally occurring materials like starch and cellulose, or synthetic commodities like nylon, polystyrene and polyethylene. Polymer functionality is defined by its molecular weight (MW), molecular size and structure, MW distribution and the degree of cross linking or chain branching. Hence, the polymer manufacturer needs to implement efficient and effective methods for determining these properties.
This article reviews the techniques available for determining the key properties of polymers, focusing on the value and benefits of size exclusion/gel permeation chromatography (SEC/GPC). The article mostly covers polymers; however, most of the principles here apply equally to protein conjugate or protein materials.
Defining the Molecular Weight of Polymers
The word “polymer” has been derived from the Greek words 'poly' and 'meros', implying many parts, and refers to a characterizing feature of polymeric materials – their chain like structure. This structure is formed by developing chemical links between a number of monomers or repeating units. For instance, polymerizing styrene, a monomer, under suitable reaction conditions, results in the polymer polystyrene (Figure 1).
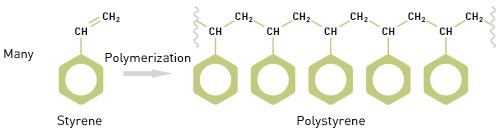
Figure 1. A defining feature of polymers is their chain-like structure, made up of repeating monomers.
A polymer’s molecular weight is related to that of the monomer, and the number of monomers present in the polymer molecule. The molecular weight of styrene is 104 Da. Hence, the molecular weight of polystyrene is 104n, where “n” is the styrene molecule number in the polymer chain. Both the distribution shape and the average MW influence the properties of a polymer. Therefore, measuring MW requires measuring the MW of individual chains and the number of chains of any specific weight.
The general distribution of polymer MW is seen in Figure 2. Using statistics, three different moments can be defined for this distribution, each being considered as an average MW. Mn is the number averaged MW, and Mw is the weight averaged MW. The midpoint of the distribution in terms of the number of molecules is Mw. The third moment, Mz, has more weighting with regards to higher MWs. The Mw:Mn ratio is termed as polydispersity, and is used for describing the distribution width.
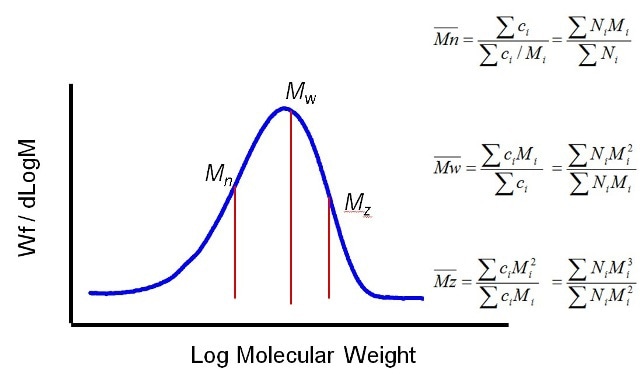
Figure 2. Average MW can be defined in a number of different ways using different moments of the distribution.
An essential point to consider while examining alternating MW technique measurements is that any absolute MW measurement must involve the absolute measurement of concentration or number of molecules.
Measuring MW - Introducing Static Light Scattering (SLS)
The different methods used for measuring MW are:
- End group analysis
- Membrane osmometry
- Viscometry
- Light scattering
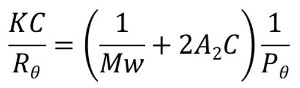
The standard approach, however, is static light scattering (SLS). The irradiation of a macromolecule by an incident light photon beam causes photons to be absorbed and re-emitted or scattered in all directions. The scattered light intensity and the polymer MW are proportional, the relationship being described by the Rayleigh equation.
Three approaches to SLS have been developed:
- Right angle light scattering (RALS) - Scattering intensity is determined at 90° to the incident beam. It offers a very good signal to noise ratio, however, does not take into account anisotropic scattering. The assumption is that the scattering intensity at 0° is just as that at 90°. This is a suitable approach for small molecules but not for anisotropic scatterers.
- Low angle light scattering (LALS) - In LALS, scattering intensity is determined at an angle very close to 0° in order to eliminate the error related to anisotropic scattering. This is fine for all molecules, however, the signal-to-noise ratio becomes challenging for smaller molecules. A combination of RALS/LALS technology is a good prospect.
- Multi-angle light scattering (MALS) – The approach adopted with MALS is measuring at several angles and extrapolating the same to determine a value for scattering intensity at 0°C. MALS is suitable for all molecule sizes but the method is more complicated than LALS or RAls.
It is possible to use all the three light scattering techniques in batch mode, but they are more frequently applied in flow mode, with the light scattering detector constituting a gel permeation/size exclusion chromatography (GPC/SEC) detector array.
GPC/SEC - Powerful Technique for Measuring MW distribution
As shown in Figure 3, GPC/SEC starts with size fractionation of a sample, after which each sample fraction is detected as it elutes from the separation column. The only disadvantage with GPC/SEC is that separation is based on the polymer molecule size, not on its MW.
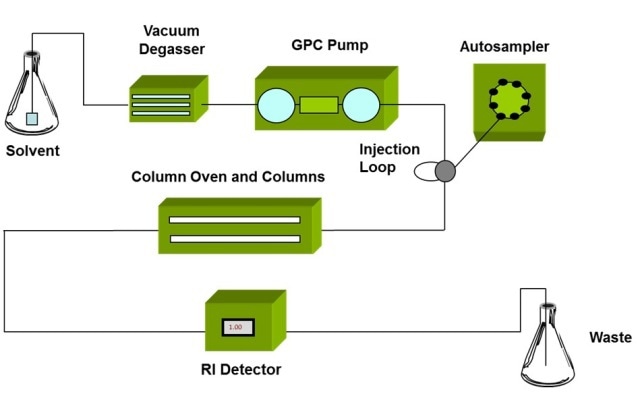
Figure 3. Schematic of a GPC/SEC set-up, detectors are positioned at the exit of the column oven to measure the properties of the eluting sample.
In GPC/SEC, the term 'absolute' MW is used for differentiating a method that directly measures MW from one that infers it, especially from calibration techniques relying on the use of a set of relevant standards.
Light scattering detectors are a convenient tool for determining MW in a GPC/SEC system set-up. SLS provides the most precise data available with present technology, and can be considered absolute in the sense of direct measurement.
The Importance of Molecular Size
Molecular size, similarly to MW, is a defining property of most polymers. A polymer molecule’s size in solution directly impacts its rheological behavior, which is linked directly to formulation performance.
MW and molecular size relationship is not constant, and different polymers show different molecular densities in solution.
Most polymer molecules are below 100 nm, and hence, the requirement for size information calls for techniques that have the ability to measure nanoparticles. Three different techniques are applied: dynamic light scattering (DLS); MALS; and SLS in combination with intrinsic viscosity (IV) measurement.
Measuring Molecular Size (1) - DLS
When compared to SLS, DLS measurements derive from the real-time fluctuations in scattered light, instead of the time-averaged data, which is the focus in the case of static techniques. DLS is mostly applied in batch mode. The illumination of a sample is performed with a laser beam, resulting in light scattering that is detected by a sensitive photon counting module.
A correlator is used to translate the determined light scattering intensity fluctuations to a measure of diffusion speed, thereby providing a value for molecule or particle size. The Stokes-Einstein equation clearly explains the relationship between size and speed of motion. Determining the scattered light intensity helps to determine particle or molecular size, more specifically hydrodynamic radius (Rh).
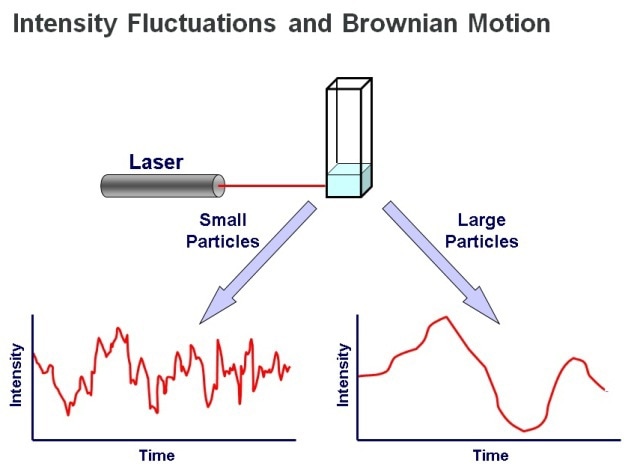
Figure 4. DLS measurements determine particle size from the pattern of intensity fluctuations in scattered light.
Measuring Molecular Size (2) - MALS
MALS is used for determining the molecular size based on the fact that the anisotropic light scattering pattern produced by larger molecules of around 10 to 15 nm radius and above is associated with their size. For this reason, MALS cannot determine molecular size for smaller molecules. For larger molecules, the radius of gyration (Rg) can be computed.
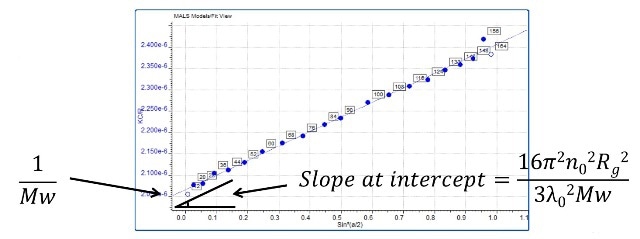
Figure 5. Rg the radius of gyration can be determined from a Zimm plot which can be produced by measuring light scattering intensity as a function of angle for particles that scatter anisotropically (> 10 - 15 nm in size).
Measuring Molecular Size (3) - SLS with IV
Even though the relation between a polymer’s molecular size and the MW is not constant, it can be determined. The parameter IV, measured in units dl/g, can be determined with viscometry measurements, and relates molecular size directly to MW for any particular polymer. IV is an inverse measure of molecular density. Polymers that are less tightly coiled have a considerably high IV, while the densely entangled ones have a low IV. Molecular size can be determined from MW measurements by SLS combined with IV. This method helps obtain values for hydrodynamic radius (Rh). It is important to note that Rh is different from Rg (Figure 6).
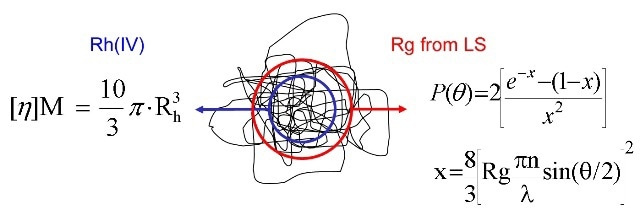
Figure 6. Rh (IV) is a different size metric to Rg measured by MALS.
Comparing Measures of Polymer Molecular Size
Different size parameters are obtained from the three methods detailed for molecular size measurement, Rh (DLS), Rg and Rh(IV). The magnitude of any difference in these three parameters is based on the molecular density and shape of that particular molecule. Molecular size, like MW, is a distributed parameter.
Investigating Molecular Structure - The Link Between Size and MW
It is possible to determine molecular size and MW distributions for a polymer using GPC/SEC and the aforementioned measurement methods. The explanation of structural characteristics depends on the use of these data along with IV measurements, which is a measure of molecular density. Table 1 shows the main ways in which IV is changed by fluctuations in the structure, relationships which underpin the value of adding a viscometer to a GPC/SEC system to determine IV, and which hence explain structure.
Table 1. Changes in polymer structure have a direct impact on IV which is consequently a useful metric for investigating structural characteristics.
| Structural or conformational change |
Effect on density |
Effect on IV |
| a) Increase chain length (MW) of linear molecule. |
Decreases |
Increases according to Mark-Houwink equation |
| b) Increase mass of chain segments, keeping chain length constant. |
Increases |
Decreases |
| c) Increase stiffness of chain. |
Decreases |
Increases |
| d) Add branches to chain, keeping MW constant. |
Increases |
Decreases |
| e) Collapse chain into dense molecule. (natural protein or aggregate) |
Increases greatly |
Decreases greatly |
IV can be determined in continuous mode or by batch techniques in a GPC/SEC set-up, but in both cases, the relative or specific viscosity is measured. Figure 7 shows a viscometer design specified for use in a GPC/SEC setup, which works similarly to a Wheatstone bridge on the balancing resistances principle.
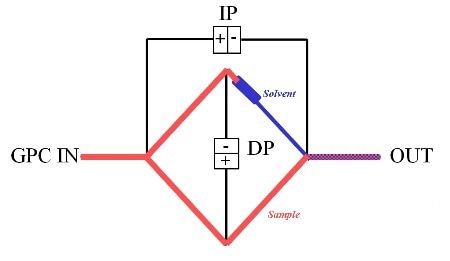
Figure 7. Schematic of differential viscometer which can be used within a GPC/SEC set-up to determine IV.
Differential pressure transducers determine the pressure drop across the center of the bridge, DP and from inlet to outlet, IP. The main design features are that the delay volume must be higher than the net elution volume of the separation column, however, with negligible flow resistance.
Using differences in IV, data about the structure using correlations outlined in Table 1, detailed data about structural characteristics can be determined from a Mark-Houwink (M-H) plot and a log-log plot of IV against MW.
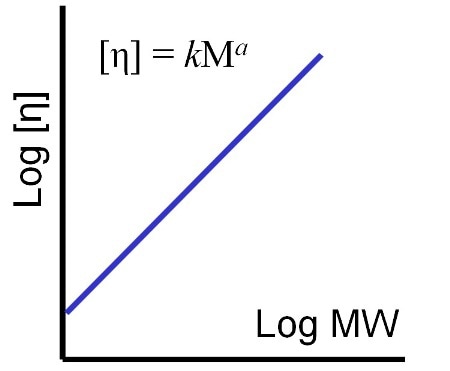
Figure 8. The shape of the M-H plot, gradient and intercept, enables the robust comparison of different polymer samples in terms of their structure.
The M-H parameters, k and a, as shown in Figure 8, can be seen from the M-H plot. Figure 9a shows an M-H plot for a considerably high MW, standard linear polystyrene in THF. This was obtained in a SEC/GPC experiment by accurately determining the MW (light scattering) and IV (viscometer) of the eluting sample. The result is a precise straight line M-H plot from which k and a values can be easily determined. The straight line shows that the polymer structure in solution does not change across all the molecular weights it contains.
The same data for a sample containing some low MW polystyrene in addition to the original material are shown in Figure 9b. Plots for three Maltodextrin batches are shown in Figure 10, the properties of which are shown in the inset table. The bulk IV values of these samples are very similar.
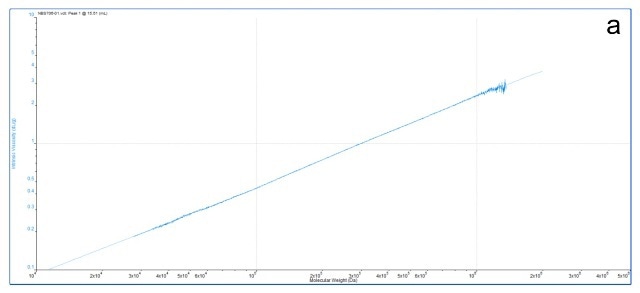
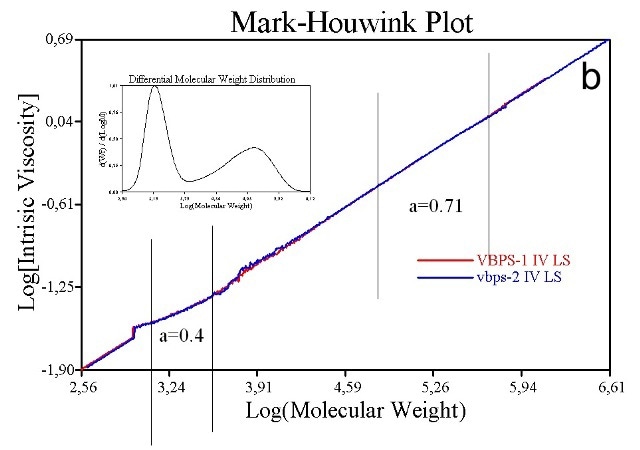
Figure 9. M-H plots for a relatively high MW linear polystyrene sample (9a) and a closely similar sample that also contains low MW material (9b) show distinct differences. The low MW linear polystyrene has a different structure and changes the M-H plot in the low MW range.
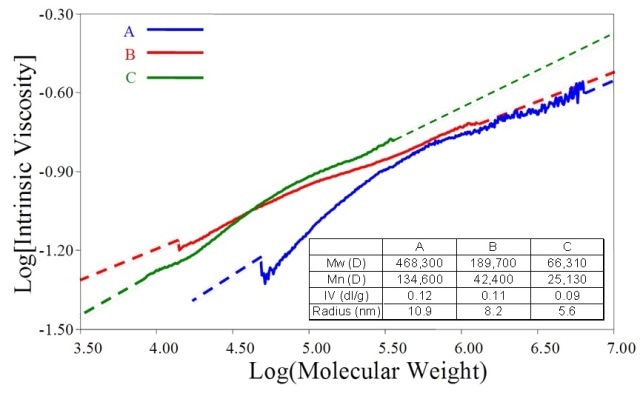
Figure 10. M-H plots for three maltodextrin samples with closely similar IV values reveal marked differences in structure.
Conclusion
The detailed characterization of polymers underlines their successful application in a large number of applications. The key properties are MW, MW distribution, molecular size and molecular size distribution, and structural characteristics such as the extent of branching. The methods show the manner in which all these properties can be determined with accuracy and efficiency, and highlight the key role of GPC/SEC for polymer development and QC.

This information has been sourced, reviewed and adapted from materials provided by Malvern Panalytical.
For more information on this source, please visit Malvern Panalytical.