Analytical methods for determining dissolved and particulate bound elements in water, such as surface, ground, fresh, waste and drinking water, are defined by international standards. Total reflection X-ray fluorescence analysis (TXRF) has not yet received approval for wastewater monitoring.
Recently, researchers explained the procedures for the quantitative analysis of Hg or As, Cd, Cr, Ni, Pb, and other elements in wastewater, and a comparison of the results was performed with ICP-OES/ MS data. This article details how TXRF spectroscopy can be used for trace element analysis of synthetic sludge and wastewater samples from industrial processes. There is a particular focus on thallium analysis, which normally fails when ICP-OES is used.
Part I: Wastewater Samples
Analysing different types of synthetic wastewater, containing around 0.5 mg/l of several elements, has proven the performance of TXRF spectroscopy for wastewater analysis.
Sample Preparation
Prior to TXRF analysis, seven different synthetic wastewater samples were prepared. In order to achieve a thin and homogenous sample layer on the quartz sample carrier, 100 µl of polyvinyl alcohol was added to a 1 ml sample. For internal standardization, 10 µl of a 0.1 g/l gallium standard solution was added. After complete homogenization, 10 µl of the sample was transferred into a siliconized quartz glass sample carrier and the sample was vacuum-dried for about 10 minutes. All of the samples were prepared 10 times, and measurements were performed in the S2 PICOFOX TXRF spectrometer with Mo excitation (50 kV, 600 µA) for 1000 s.
The computation of detection limits was performed based on the equation:

where LLDi – lower limit of detection of the element i, Ci – Concentration of the element i, Ni is the area of the fluorescence, and NBG is the background area.
The method detection limits were determined based on the US Environmental Protection Agency (EPA) method for calculation of MDL, 40CFR Part 136, appendix B, Revision 1.
Results
There is a strong variation in the maximum contaminant levels (MCL) in wastewater based on industries and countries. Figures 1 and 2 show the legal limits of detection for several different German industries in the form of red bars. An example for this is that the MCL for Cr and Ni in ceramics production is set at 0.1 mg/l, but in the steel industry is 0.5 mg/l. In the print industry, Cr values of 1 mg/l and Ni values of 2 mg/l are within the required limits.
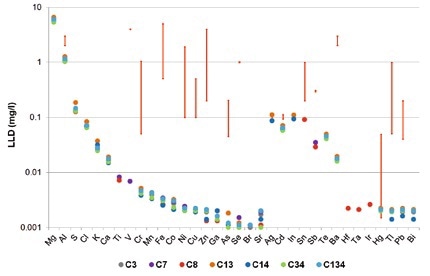
Figure 1. Detection limits for TXRF measurements of seven different synthetic wastewater samples (colored dots). The red bars indicate the legal limits for different German industries.
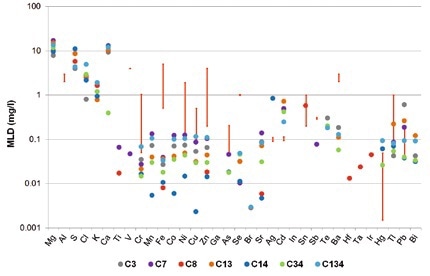
Figure 2. Method detection limits for TXRF measurements of seven different synthetic wastewater samples (colored dots). The red bars indicate the legal limits for different German industries.
As seen in Figure 1, for different elements (Ti, Va, Cr, Mn, Fe, Co, Ni, Cu, Zn, As, Se, Sr, Hf, Ta, Ir, and Bi), TXRF provides detection limits of less than 10 µg/l, with full recovery rates +/- 10%. Based on an acceptable range of the US-EPA of 30% (blue area in Figure 3), it is also possible to accurately quantify elements such as Ba, Tl and Pb. In synthetic wastewater, the detection limits for Tl and Pb are in the 2 µg/l range.
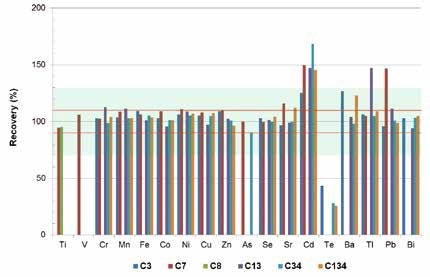
Figure 3. Recovery rates of TXRF measurements for specific elements. The red lines show a deviation range of +/- 10%, the grey area shows a range of +/- 30% according to the US-EPA.
It is possible to achieve detection limits of less than 4 µg/l for Hg after fixation using a treatment with thiourea (details are not included). One sample alone had W (LLD: 2µg/l), though those details are also not shown. The results establish that the detection limits achieved by TXRF measurements are much lesser than the legal wastewater limits in most countries.
TXRF is hence suitable for quickly studying all considered elements. Even for the more strict method detection limits by US-EPA, it is possible to detect and quantify most elements at concentration limits far below these limits (Figure 2).
The elements Ag, Cd, In, Sn, Sb, and Te are also measured using TXRF in the concentration range of the legal limits. This enables a rapid examination of any wastewater sample. If there is a positive indication, an enrichment procedure needs to be applied for a highly accurate and sensitive quantification.
Part II: Special Topic - Tl Analysis
Every year, mainly in Russia, China and Kazakhstan, around 10 tons of thallium (TI) are produced. Through waste combustion, Tl may be discharged into surface water. Tl has some amount of toxicity, with a lethal dosage being 10 mg per kg of body weight. Hence, the German wastewater ordinance has specified a maximum permissible value in the range of 50 µg/l. Presently, Tl is determined using ICP-OES or AAS. However, such data is mostly unreliable.
TXRF was applied to measure five wastewater samples with a high matrix content of 1%. With a 1:3 dilution with 0.5 mol nitric acid, a measurement time of 2000 s, using Pt as an internal standard, and sample drying on quartz carriers at 40 °C, optimal repeatability of TXRF measurements was achieved. The TXRF results obtained were compared with ICP-OES and ICP-MS data.
Results
It was observed that the Tl concentrations in all wastewater samples were less than 100 µg/l. In wastewater with a high matrix content, the lowest detection limit was calculated as 29 µg/l. The sample LOD with low matrix content was better than 4 µg/l.
As seen in Figure 4, TXRF values were in good agreement with ICP -MS results, as well as with the various AAS measurements (not shown). It is to be noted that the ICP-OES measurements from two independent laboratories failed, and the recovery rates were normally between just 40% and 0%.
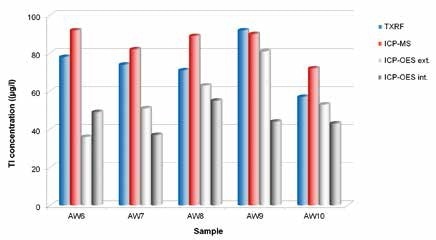
Figure 4. Round robin test for determination of Tl concentrations in different wastewater samples
Conclusion
The results of the wastewater analysis have shown how TXRF measurements are successfully applied for the multi-element analysis of wastewater. It is possible to directly quantify most elements after a brief and easy sample preparation procedure. The standard detection limits are far below most legal limits.
From the results of the TI analysis, it has been demonstrated that when compared to ICP-OES, TXRF is more reliable and consistent for detecting Tl traces in wastewater. The detection limits are considerably less than most regulatory limits. The total process time, along with sample preparation and calibration for any ICO or AAS measurement of Tl, is normally more than 1 hour. Even though TXRF measurements take more time (more than 10 minutes), the total process time is considerably shorter, in the range of 20-40 minutes.

This information has been sourced, reviewed and adapted from materials provided by Bruker Nano Analytics.
For more information on this source, please visit Bruker Nano Analytics.